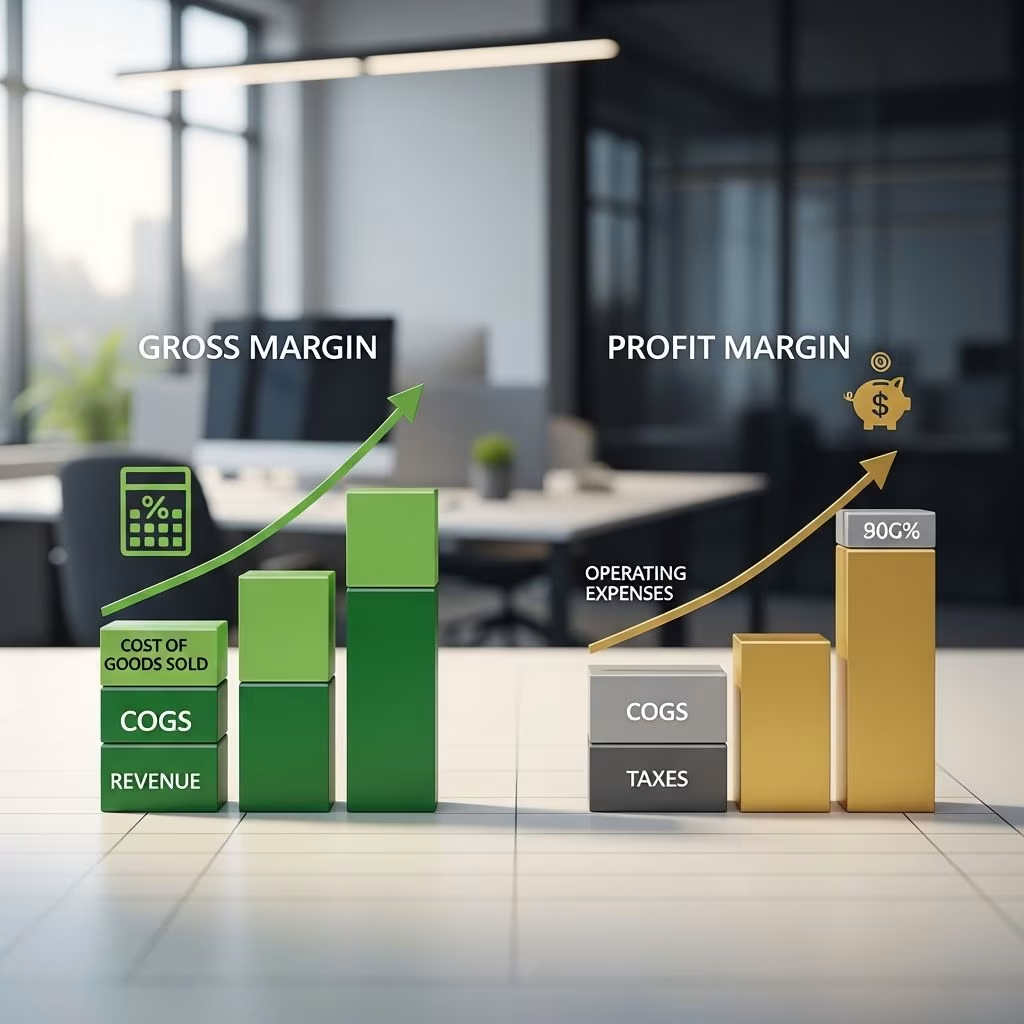
Gross Margin vs. Profit Margin: Understanding the Key Differences
When analyzing a company’s financial health, investors and business analysts frequently encounter two critical profitability metrics: gross margin and profit margin. While these terms are often used interchangeably, they represent distinctly different measures of a company’s financial performance. Understanding the differences between these two metrics is essential for making informed investment decisions and evaluating a company’s operational efficiency and overall profitability. This comprehensive guide will help you distinguish between gross margin and profit margin, explore how each is calculated, and understand why both metrics matter in financial analysis.
What is Gross Margin?
Gross margin represents the percentage of revenue that remains after a company deducts the cost of goods sold (COGS). This metric measures how efficiently a company produces its products or delivers its services relative to sales revenue. Essentially, it indicates what portion of each dollar in revenue becomes profit before accounting for operating expenses, interest, and taxes.
Gross margin focuses exclusively on the direct costs associated with production, including raw materials, direct labor, and manufacturing overhead. It does not account for indirect expenses such as salaries, marketing, administrative costs, or debt servicing. This limited scope makes gross margin particularly useful for assessing production efficiency and pricing strategy.
Gross Margin Formula
The calculation for gross margin is straightforward:
Gross Margin = (Revenue – Cost of Goods Sold) / Revenue × 100
Alternatively, it can be expressed as:
Gross Margin = Gross Profit / Revenue × 100
For example, if a company generates $1,000,000 in revenue with $600,000 in cost of goods sold, the gross margin would be ($1,000,000 – $600,000) / $1,000,000 × 100 = 40%. This means that 40% of every dollar earned remains after covering direct production costs.
What is Profit Margin?
Profit margin, often referred to as net profit margin, represents the percentage of revenue that remains as profit after all expenses have been deducted. Unlike gross margin, profit margin accounts for all costs of doing business, including operating expenses, interest on debt, taxes, and any other expenses incurred during the period.
Profit margin provides a comprehensive view of a company’s overall profitability and operational efficiency. It reveals how much of every dollar in sales ultimately translates into bottom-line profit. This metric is particularly valuable for comparing the profitability of different companies, regardless of their size or industry, as it normalizes profit to a percentage of revenue.
Profit Margin Formula
The calculation for profit margin (specifically net profit margin) is:
Net Profit Margin = (Net Income / Revenue) × 100
Using the previous example, if the company’s operating expenses total $250,000, interest expense is $50,000, and taxes are $60,000, the net income would be $40,000. The profit margin would then be ($40,000 / $1,000,000) × 100 = 4%. This indicates that the company retains only 4% of its revenue as profit after all expenses.
Key Differences Between Gross Margin and Profit Margin
While both metrics measure profitability, they serve different purposes and provide different insights into business performance. Here are the primary differences:
Scope of Expenses
- Gross Margin: Considers only the direct costs of producing goods or services, specifically the cost of goods sold.
- Profit Margin: Includes all expenses: cost of goods sold, operating expenses, interest, taxes, and other miscellaneous costs.
Purpose and Application
- Gross Margin: Used to evaluate production efficiency, pricing strategy, and the effectiveness of supply chain management. It helps identify whether a company is controlling its manufacturing costs effectively.
- Profit Margin: Used to assess overall business profitability and operational effectiveness across all functions. It provides insight into how well a company manages its entire business.
Calculation Simplicity
- Gross Margin: Calculated using only revenue and cost of goods sold, making it simpler and more straightforward.
- Profit Margin: Requires comprehensive financial data from the income statement, including all operating and non-operating expenses.
Variability Across Industries
- Gross Margin: Varies significantly by industry due to different production methods and cost structures. Retail businesses typically have lower gross margins than software companies.
- Profit Margin: Also varies by industry but provides a more comparable measure when adjusted for industry-specific factors.
Comparative Example: Understanding the Difference
Consider two companies in different industries to illustrate how these margins can differ significantly:
Retail Company Example
A retail clothing store generates $2,000,000 in annual revenue. Its cost of goods sold is $1,200,000, resulting in a gross margin of 40%. However, after accounting for rent ($300,000), employee salaries ($200,000), utilities ($50,000), marketing ($100,000), and other operating expenses ($80,000), along with taxes ($25,000), the net profit is $45,000, yielding a profit margin of only 2.25%.
Software Company Example
A software company generates $2,000,000 in annual revenue with cost of goods sold (primarily server hosting and support) of $200,000, resulting in a gross margin of 90%. After accounting for salaries ($800,000), research and development ($300,000), marketing ($200,000), and other operating expenses ($150,000), along with taxes ($70,000), the net profit is $280,000, yielding a profit margin of 14%.
This comparison demonstrates that gross margin alone does not provide a complete picture of profitability. While both companies have revenue of $2,000,000, their profit margins differ significantly due to differences in operating expenses and industry structure.
Why Both Metrics Matter
Relying on either metric alone can lead to incomplete or misleading conclusions about a company’s financial health. Here’s why both are important:
Gross Margin Significance
- Identifies production inefficiencies or rising manufacturing costs
- Reveals pricing power and competitive positioning
- Helps benchmark against industry competitors
- Indicates whether a company can cover operating expenses
- Reflects the core business model’s fundamental viability
Profit Margin Significance
- Shows the bottom-line profitability of the entire business
- Reflects management’s ability to control all costs
- Enables fair comparison between companies of different sizes
- Indicates the company’s ability to generate returns for shareholders
- Provides insight into overall operational efficiency
Relationship Between Gross Margin and Profit Margin
Understanding the relationship between these two metrics provides valuable insights. A high gross margin does not guarantee high profit margin if the company has substantial operating expenses. Conversely, a company might have a modest gross margin but achieve a respectable profit margin through rigorous cost control in other areas.
The difference between gross margin and profit margin essentially represents the impact of operating expenses on profitability. By analyzing this gap, investors can assess management’s efficiency in controlling costs beyond direct production. A widening gap might indicate rising administrative or operating expenses, while a narrowing gap could suggest improved operational efficiency.
Analyzing Margins: What’s Healthy?
Healthy margin targets vary significantly by industry. Technology and software companies often maintain gross margins above 70% and profit margins of 15-20% or higher. Retail businesses typically operate with gross margins of 20-50% and profit margins of 2-5%. Manufacturing companies usually fall somewhere in between, with gross margins of 30-50% and profit margins of 5-15%.
When evaluating margins, it’s essential to compare companies within the same industry and consider historical trends. An improving trend in either margin typically indicates positive momentum, while declining margins may signal challenges in production efficiency or rising operating costs.
Frequently Asked Questions
Q: Can a company have a high gross margin but low profit margin?
A: Yes, absolutely. A company might produce products efficiently (high gross margin) but incur substantial operating expenses such as research and development, marketing, or administrative costs, resulting in a low profit margin. Technology companies often exemplify this scenario.
Q: Which metric is more important for investment decisions?
A: Both are important, but they serve different purposes. Gross margin indicates production efficiency, while profit margin shows overall profitability. Use both together for comprehensive analysis. Profit margin is generally more relevant for comparing investment opportunities across different companies and industries.
Q: How can a company improve its gross margin?
A: Companies can improve gross margin by reducing cost of goods sold through better supplier negotiations, increasing production efficiency, implementing lean manufacturing, reducing waste, or raising prices. Any of these strategies can increase the percentage of revenue remaining after direct production costs.
Q: Is profit margin always lower than gross margin?
A: In almost all cases, yes. Since profit margin accounts for all expenses including operating costs, it will typically be lower than gross margin. The only exception would be a highly unusual scenario where operating income somehow exceeded gross profit, which is practically impossible under normal business operations.
Q: Should I focus on only one type of margin when analyzing stocks?
A: No, analyzing both margins provides a more complete picture. Start with gross margin to understand production efficiency, then examine profit margin to assess overall profitability. Compare both metrics over time and against competitors to identify trends and potential issues.
Q: How do gross margin and profit margin relate to cash flow?
A: While margins are based on accrual accounting profits, cash flow represents actual cash movement. A company can be profitable on paper but struggle with cash flow due to timing issues with receivables or inventory. Always analyze both profitability margins and cash flow metrics for complete financial health assessment.
References
- Financial Accounting Standards Board (FASB) — Accounting Standards Codification — FASB. 2024. https://www.fasb.org/
- U.S. Securities and Exchange Commission (SEC) — Investor Publications: Financial Statements and Reports — SEC. 2024. https://www.sec.gov/investor/pubs.shtml
- CFA Institute — Financial Analysis: Profitability Ratios and Margin Analysis — CFA Institute. 2024. https://www.cfainstitute.org/
- Corporate Finance Institute — Gross Margin vs. Net Profit Margin: Key Financial Metrics Explained — Corporate Finance Institute. 2024. https://corporatefinanceinstitute.com/
- Journal of Financial and Quantitative Analysis — Profitability Metrics in Corporate Performance Evaluation — University of Washington. 2023. https://jfqa.org/
This article is general information, not personal financial advice. Consider your own situation, or speak with a licensed adviser, before acting on it.