

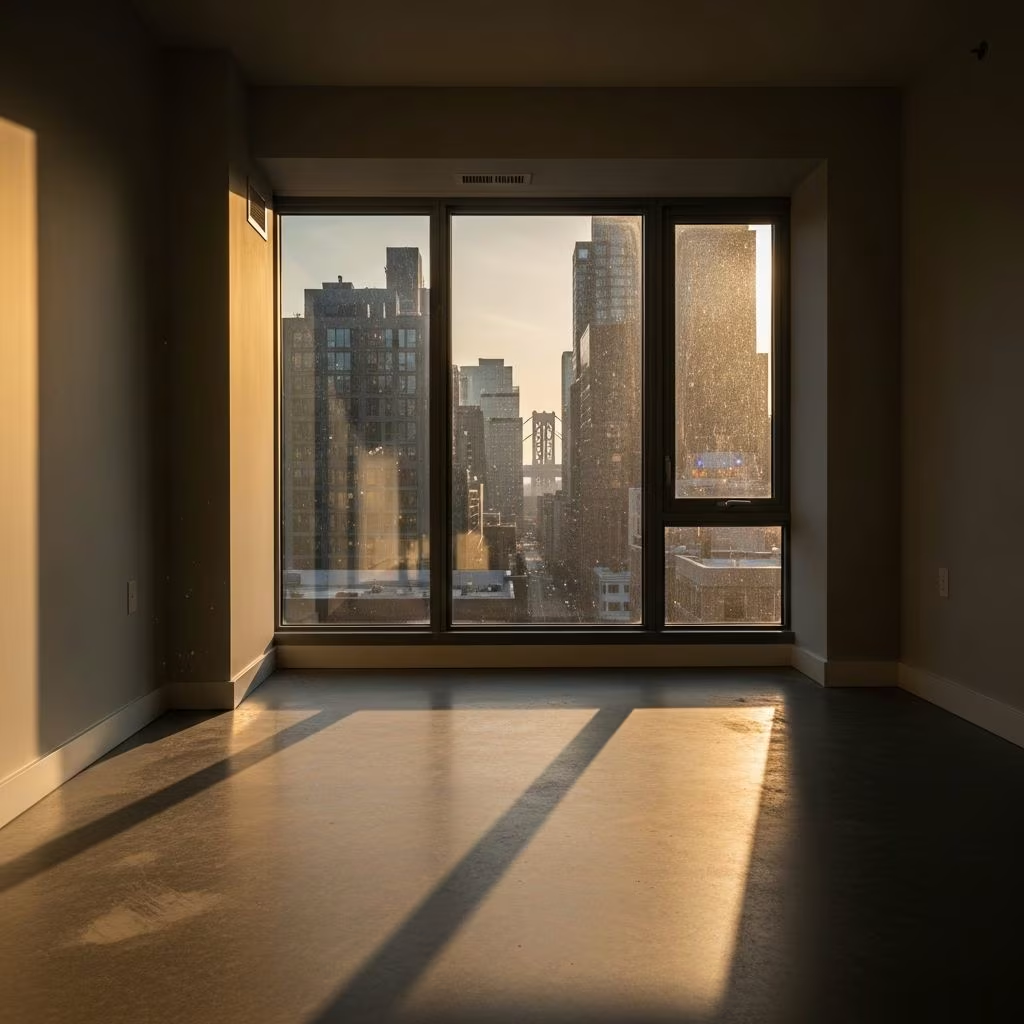
The vacancy rate stands as a fundamental metric in the real estate sector, quantifying the proportion of unoccupied rental units relative to the total available supply within a specific property, building, or geographic region. This percentage offers critical insights into supply-demand dynamics, helping investors, landlords, property managers, and prospective homebuyers gauge market health and make informed decisions.
Defining Vacancy Rates Across Property Types
In residential real estate, vacancy rates primarily track empty apartments, houses, or condos available for rent. For instance, in a multi-family building, it measures how many units sit tenant-free at any given moment. Commercial real estate extends this concept to office spaces, retail storefronts, and industrial warehouses, where high vacancy might signal economic slowdowns or shifts in business needs.
Two primary variants exist: physical vacancy, which counts purely unoccupied spaces, and economic vacancy, which factors in lost revenue from concessions, below-market rents, or non-revenue-generating occupied units like manager’s quarters. Physical vacancy focuses on sheer emptiness, while economic vacancy captures the true financial impact.
- Physical Vacancy: Direct measure of empty units, ideal for quick snapshots of availability.
- Economic Vacancy: Accounts for income shortfalls, providing a fuller profitability picture.
- Market Vacancy: Broader regional statistic reflecting overall rental supply and demand balance.
Step-by-Step Calculation Methods
Computing vacancy rates is straightforward, relying on simple ratios tailored to the analysis timeframe. For a point-in-time assessment of a property, divide vacant units by total units and multiply by 100. Consider an apartment complex with 120 units, where 11 remain empty: (11 / 120) × 100 = 9.17%. This reveals nearly 10% unutilized capacity.
For time-based analysis, especially annual performance, use days vacant over total available days. A unit empty for 23 days in a 365-day year yields (23 / 365) × 100 ≈ 6.3%. This method suits single properties or portfolios tracking turnover.
Economic vacancy employs a revenue formula: (Gross Potential Rent – Actual Rental Income) / Gross Potential Rent × 100. If potential yearly rent is $350,000 but actual collections hit $315,000, the rate is (35,000 / 350,000) × 100 = 10%.
| Type | Formula | Example |
|---|---|---|
| Physical (Units) | (Vacant Units / Total Units) × 100 | 11/120 × 100 = 9.17% |
| Physical (Days) | (Vacant Days / Total Days) × 100 | 23/365 × 100 = 6.3% |
| Economic | (Potential Rent – Actual Rent) / Potential Rent × 100 | $35k/$350k × 100 = 10% |
Ideal Benchmarks and Healthy Ranges
Real estate professionals view 5% to 10% as a sweet spot for vacancy rates in most markets. This range signals balanced supply and demand: enough turnover for tenant choice without excess emptiness eroding profits. Below 5%, landlords wield pricing power amid fierce competition; above 10%, downward pressure on rents often follows as owners compete for occupants.
Context matters—urban hotspots like major cities may sustain lower rates due to high demand, while suburban or rural areas tolerate higher ones. Commercial sectors vary too: retail might aim under 7%, offices 8-12%.
- Under 5%: Seller’s market; potential for rent hikes.
- 5-10%: Equilibrium; stable income outlook.
- Over 10%: Buyer’s market; investment caution advised.
Interpreting High Vacancy Signals
Elevated vacancy rates often spotlight underlying issues. Property-specific culprits include uncompetitive rents, deferred maintenance, suboptimal location, or weak marketing. If a building lags peers, renovations or repricing may be needed.
Market-wide highs suggest oversupply, perhaps from new constructions flooding inventory or economic downturns curbing demand. Investors eyeing such areas might negotiate better deals but face prolonged lease-up times and income volatility.
In commercial contexts, high vacancies could reflect remote work trends emptying offices or e-commerce shrinking retail footprints. Policymakers monitor these for housing affordability cues.
Low Vacancy: Opportunities and Risks
Conversely, scant vacancies denote robust demand outpacing supply. Properties enjoy steady cash flow, premium rents, and tenant selectivity. This environment favors sellers and boosts property appraisals.
Yet, ultra-low rates risk future corrections—overbuilding may ensue, or quality tenants might overlook aging stock. Savvy investors scout emerging low-vacancy zones for appreciation potential.
Vacancy vs. Occupancy: Complementary Metrics
Occupancy rate is vacancy’s mirror: Occupied Units / Total Units × 100, or 100% minus vacancy percentage. High occupancy (90-95%) aligns with optimal vacancy. Tracking both reveals trends—like seasonal dips or management efficacy.
Availability rates in commercial leases differ slightly, including spaces with lease expirations soon, offering forward-looking insights.
Real-World Data and Trends
U.S. Census Bureau tracks national rental vacancies, while bodies like Canada Mortgage and Housing Corporation report metropolitan stats biannually. Recent data shows urban rates ticking up post-pandemic due to migration shifts, hovering 6-8% in many metros.
Investors cross-reference with cap rates and NOI for holistic views. Tools from real estate platforms aggregate local figures, aiding due diligence.
Strategic Implications for Investors
For rental property buyers, low local vacancies predict reliable yields; high ones offer entry discounts but demand turnaround plans. Use rates to model pro formas: higher vacancy assumptions buffer conservative projections.
Landlords mitigate risks via proactive leasing, competitive pricing, and amenities boosting appeal. Diversifying across markets hedges regional fluctuations.
Homebuyers and Vacancy Insights
Prospective owners monitor vacancies to assess rental potential if flipping to income properties. High rates might signal softening home values; low ones suggest competitive bidding. In hot markets, low vacancies parallel homeownership squeezes, validating buy-vs-rent analyses.[10]
Practical Tools for Tracking Vacancy
Property management software automates calculations, integrating with market reports. Free Census tools provide baselines; paid services like CoStar deliver granular commercial data.
- Excel spreadsheets for custom portfolios.
- Government portals for macro trends.
- MLS integrations for real-time listings.
Frequently Asked Questions
What is a good vacancy rate for rentals?
Aim for 5-10%; below signals strength, above suggests adjustments.
How does vacancy affect property value?
Higher rates lower cap rates and appraisals due to income risk.
Physical vs. economic vacancy—which matters more?
Economic for profitability; physical for operational snapshots.
Can vacancy rates predict market crashes?
They flag imbalances but pair with other indicators like job growth.
How to lower high vacancy in my property?
Review pricing, upgrade units, enhance marketing, screen tenants efficiently.
References
- What is Vacancy Rate? Meaning & Definition — Qandle. 2023. https://www.qandle.com/glossary-vacancy-rate
- What is a vacancy rate and how is it calculated? — Rocket Mortgage. 2025-01-15. https://www.rocketmortgage.com/learn/vacancy-rate
- Vacancy Rate — Corporate Finance Institute. 2024. https://corporatefinanceinstitute.com/resources/commercial-real-estate/vacancy-rate/
- What Is A Vacancy Rate? — Realized 1031. 2024. https://www.realized1031.com/glossary/vacancy-rate
- Vacancy Rate | Formula + Calculator — Wall Street Prep. 2025. https://www.wallstreetprep.com/knowledge/vacancy-rate/
- Rental vacancy rate — Wikipedia (citing U.S. Census Bureau). 2026-01-01. https://en.wikipedia.org/wiki/Rental_vacancy_rate
This article is general information, not personal financial advice. Consider your own situation, or speak with a licensed adviser, before acting on it.


