

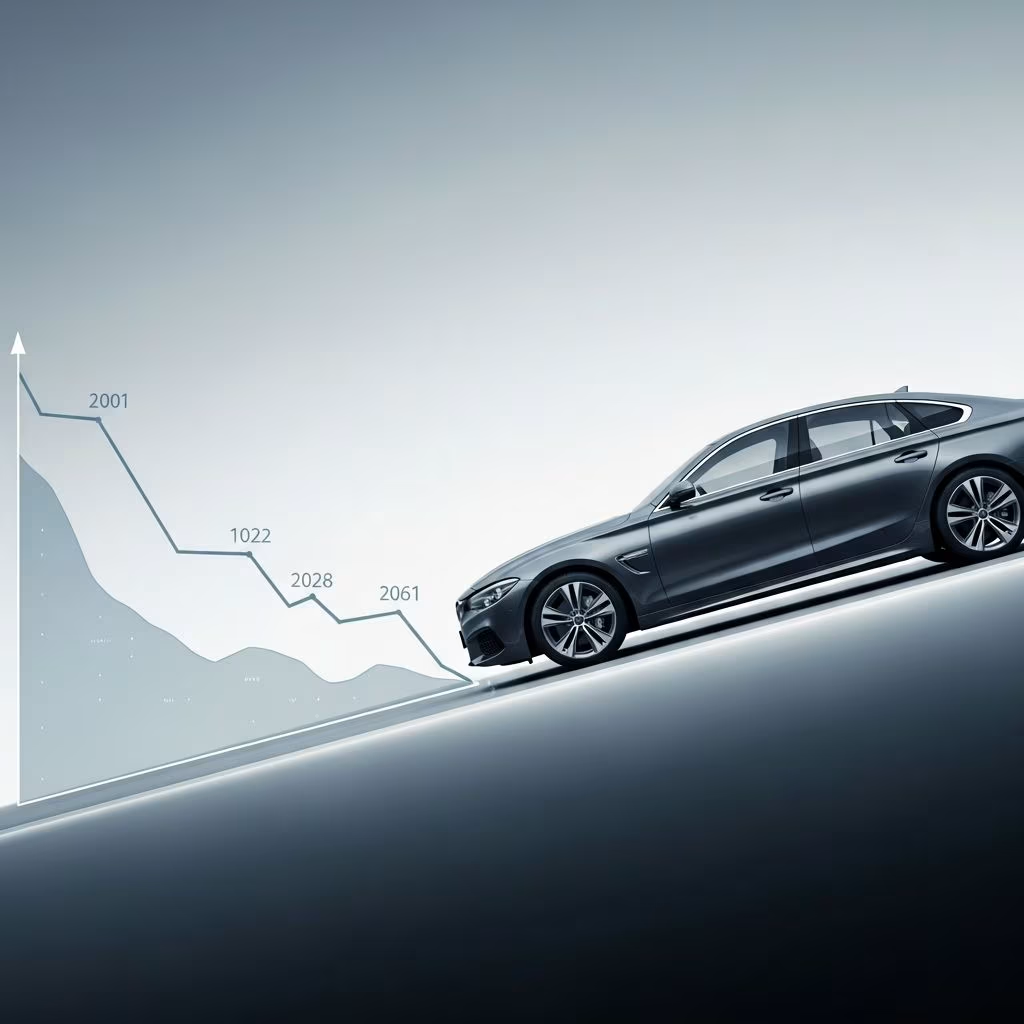
Purchasing a vehicle represents one of the largest financial commitments most people make, yet many car owners overlook a critical aspect of vehicle ownership: depreciation. From the moment a car leaves the dealership lot, it begins losing value—a process that continues throughout its lifespan. Understanding how and why vehicles depreciate can help buyers make more informed purchasing decisions and develop strategies to minimize financial loss when it’s time to sell or trade in their vehicles.
The Fundamentals of Vehicle Depreciation
Vehicle depreciation refers to the decline in a car’s monetary value over time. This process is inevitable and affects every vehicle on the road, regardless of brand, model, or condition. On average, new cars depreciate about 30% over the first two years, with additional depreciation of 8-12% annually thereafter. However, 2026 market data reveals that vehicles aged between two and six years experience depreciation rates averaging approximately 11.9% annually, while three-year-old vehicles typically retain around 58% of their original MSRP.
The depreciation curve is not linear. The steepest value loss occurs in the first year of ownership, when a vehicle transitions from “new” to “used.” This initial hit can be substantial, and understanding this pattern helps explain why purchasing a vehicle just one to two years old can offer significantly better value than buying brand new.
Geographic and Market Variations in Value Loss
Depreciation rates are not uniform across all regions or markets. International comparisons reveal notable differences in how vehicles lose value depending on location. In the USA, cars experience a 32.36% depreciation rate over three years, while vehicles in the UK face a slightly higher average depreciation rate of 38.72%. These variations stem from differences in market demand, insurance costs, fuel prices, and regional economic conditions.
Within the United States, market stabilization has influenced depreciation patterns. After several years of volatile pricing and supply chain disruptions, the automotive market in 2026 is returning to more predictable patterns. The used vehicle index has largely flattened after years of dramatic movement, suggesting that buyers and sellers are operating with more confidence and consistency in valuation.
Factors That Accelerate Vehicle Depreciation
While all vehicles depreciate, certain factors cause some cars to lose value much faster than others:
- Vehicle Type and Model: Certain makes and models hold value better than others. Luxury vehicles and specialty cars may experience faster depreciation due to higher maintenance costs and smaller buyer pools. Electric vehicles show particularly high sensitivity to market conditions, with diminished value losses ranging from 18-30%.
- Mileage and Usage: A vehicle’s actual mileage significantly impacts its residual value. Cars driven extensively lose value faster than those with lower mileage, as higher mileage correlates with increased wear and potential mechanical issues.
- Accident History: Vehicles with accident history face substantial value loss. Luxury sedans experience diminished value losses of 15-25% following accidents, while electric vehicles face losses as high as 18-30%. Even minor accidents can reduce a vehicle’s resale value substantially once disclosed to potential buyers.
- Maintenance Records: Poor maintenance or lack of service documentation accelerates depreciation. Buyers demand significant discounts for vehicles without clear maintenance histories, as they cannot verify the vehicle’s condition and longevity potential.
- Fuel Type and Technology: The market’s shift toward electrification has created winners and losers in the depreciation landscape. Traditional gasoline vehicles maintain relatively stable values, while electric vehicles experience more pronounced value fluctuations as battery technology and charging infrastructure evolve.
- Trim Level and Options: Higher trim levels and popular options may depreciate at different rates than base models. Specialized options that appeal to niche markets may depreciate faster than widely desired features.
Segment-Specific Depreciation Patterns
Different vehicle categories experience varying depreciation trajectories based on market demand and buyer preferences:
| Vehicle Segment | Typical Annual Depreciation Range | Market Characteristics |
|---|---|---|
| Compact and Economy Cars | 6-10% (diminished value) | Moderate sensitivity; stable buyer base; practical value retention |
| Mid-Size Sedans | 8-14% (diminished value) | Moderate sensitivity; broad appeal maintains baseline value |
| Luxury Sedans | 15-25% (diminished value) | High sensitivity; more volatile based on brand perception |
| Premium SUVs | 12-22% (diminished value) | High sensitivity; market-dependent based on fuel prices |
| Pickup Trucks (High Trim) | 10-18% (diminished value) | Medium-high sensitivity; utility value supports retention |
| Electric Vehicles | 18-30% (diminished value) | Very high sensitivity; rapidly evolving technology impacts value |
This segmentation demonstrates that buyers are increasingly price-sensitive across segments, with higher willingness to pay for vehicles with clean history and lower depreciation risk.
The First-Year Depreciation Cliff
The most dramatic value loss occurs during a vehicle’s first year. New cars can lose anywhere from 15-25% of their purchase price within the first 12 months, depending on the specific model and market conditions. This phenomenon, often called the “depreciation cliff,” explains why purchasing a one-year-old used vehicle often provides better value than buying new.
Several factors contribute to this initial steep decline. When a car is sold as “used” rather than “new,” it loses the new-car premium that many buyers will pay. Additionally, manufacturers’ incentive programs and rebates that may have been available at purchase no longer apply to used inventory. The psychological shift from “new” to “used” significantly impacts buyer perception and willingness to pay.
Long-Term Depreciation Trends
After the initial two-year depreciation surge, vehicles enter a more stable depreciation phase. From years three to ten, most vehicles depreciate at relatively consistent annual rates, typically between 8-12% per year. This steadier decline allows owners to better predict their vehicle’s future value and plan accordingly.
Vehicles that reach the 10-year mark often experience even slower depreciation rates, sometimes stabilizing at less than 5% annual decline. However, at this stage, mechanical reliability and maintenance history become increasingly important factors in determining residual value. A well-maintained 10-year-old vehicle may retain more value than a poorly maintained 5-year-old vehicle.
Market Recovery and Stabilization in 2026
The automotive market in 2026 represents a significant shift from the volatile pricing environment of recent years. After years of unpredictable pricing swings, vehicle depreciation patterns are returning closer to historical norms. This stabilization offers benefits to both buyers and sellers by making vehicle valuations more predictable and transparent.
Inventory levels have improved, and production has largely recovered from the shortages that disrupted the industry, creating a more balanced market where depreciation follows established patterns rather than wild swings. This stability allows consumers to make purchasing and ownership decisions with greater confidence in their vehicles’ future values.
Strategies to Minimize Depreciation Impact
- Purchase Certified Pre-Owned: Buying a vehicle that is one to three years old captures the worst of the depreciation curve while benefiting from manufacturer warranties and lower maintenance risks.
- Maintain Meticulous Records: Comprehensive maintenance documentation preserves value by demonstrating the vehicle has been properly cared for, reducing buyer concerns about hidden issues.
- Avoid High-Risk Models: Research depreciation patterns for specific makes and models before purchasing. Some vehicles are known to depreciate faster due to market preferences or reliability concerns.
- Keep Mileage Reasonable: Try to limit annual mileage to industry averages (typically 12,000-15,000 miles annually) to minimize the mileage penalty at resale time.
- Protect Against Accidents: Drive defensively and maintain proper insurance to avoid accidents, which substantially reduce vehicle value regardless of repair quality.
- Choose Popular Options: When selecting features and trim levels, choose popular configurations that appeal to broad buyer audiences rather than niche customizations.
- Monitor Market Trends: Stay informed about technological changes, regulatory shifts, and market preferences that might affect your vehicle’s segment.
Frequently Asked Questions
Q: How much does a car depreciate in the first year?
A: Most new vehicles lose between 15-25% of their value during the first year, though this varies by model and market conditions. This initial depreciation represents the steepest value loss a vehicle will experience.
Q: Is it better to buy new or used to minimize depreciation losses?
A: Purchasing a one to three-year-old vehicle typically minimizes depreciation impact, as the worst value loss has already occurred. You pay significantly less than new-car prices while still obtaining a relatively young vehicle.
Q: Do luxury cars depreciate faster than regular vehicles?
A: Yes, luxury vehicles often depreciate faster than mainstream vehicles due to higher maintenance costs, smaller buyer pools, and greater sensitivity to economic conditions. Luxury sedans can experience 15-25% diminished value impacts, compared to 6-10% for economy vehicles.
Q: What vehicle types hold value best?
A: Toyota vehicles and other Japanese brands known for reliability tend to have the strongest resale values. Pickup trucks and popular SUVs also retain value well due to consistent buyer demand.
Q: How does accident history affect depreciation?
A: Accident history can reduce a vehicle’s value by 6-30% depending on the severity and vehicle type. Electric vehicles face the highest sensitivity, losing 18-30% of value when accident history is disclosed.
Q: Can regular maintenance prevent depreciation?
A: While maintenance cannot prevent depreciation, it can significantly slow its rate by preserving the vehicle’s mechanical condition and supporting higher resale values. Detailed maintenance records are particularly valuable when selling used vehicles.
Conclusion: Making Informed Ownership Decisions
Vehicle depreciation is an unavoidable aspect of car ownership, but understanding how and why it occurs empowers consumers to make smarter financial decisions. By recognizing depreciation patterns, researching specific models, and implementing value-preservation strategies, car owners can minimize their financial losses and maximize the return on their automotive investments.
The 2026 market environment offers particular advantages, with stabilized pricing and more predictable depreciation patterns. Whether buying new or used, first-time buyers or experienced owners benefit from understanding their vehicle’s likely depreciation trajectory and planning their ownership strategy accordingly. Armed with this knowledge, consumers can transform depreciation from an unwelcome surprise into a manageable factor in their overall vehicle ownership costs.
References
- 2026 Auto Market Trends: How Vehicle Values, Insurance Claims Impact Depreciation — Appraisal Engine. 2026. https://appraisalengine.com/company/2026-auto-market-trends-vehicle-appraisals/
- The 2026 Motoring Depreciation Report – USA and UK Analysis — Zutobi. 2026. https://zutobi.com/us/driver-guides/motoring-depreciation-uk-and-us-report
- Diminished Value Loss by Vehicle Segment (2026 Data) — Appraisal Engine. 2026. https://appraisalengine.com/company/diminished-value-loss-by-vehicle-segment-2026/
- Car Depreciation Calculator – Trade-In Value and Resale Value — Kelley Blue Book. https://www.kbb.com/car-depreciation/
This article is general information, not personal financial advice. Consider your own situation, or speak with a licensed adviser, before acting on it.


