

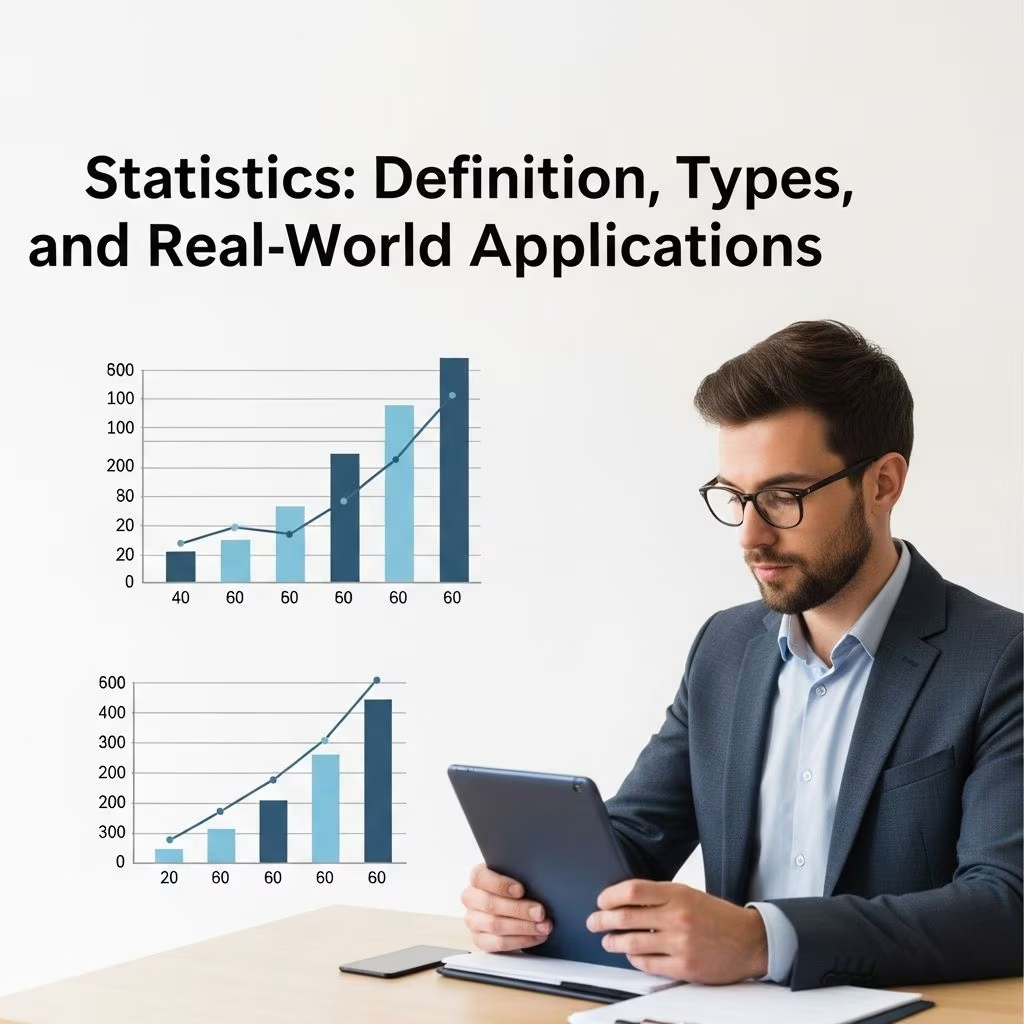
What Is Statistics?
Statistics is a mathematical science that involves collecting, analyzing, interpreting, and presenting data. It plays a crucial role in modern decision-making across various industries, from finance and healthcare to marketing and public policy. The term “statistics” can refer both to the discipline itself and to numerical facts or data that have been collected and analyzed.
In essence, statistics provides a framework for understanding patterns, trends, and relationships within data. By converting raw numbers into meaningful information, statistics enables individuals and organizations to make informed decisions based on evidence rather than intuition or speculation. Whether used in academic research, business analytics, or government planning, statistics serves as the backbone of evidence-based decision-making.
Understanding the Fundamentals of Statistics
Statistics emerged as a formal discipline during the 17th century, evolving from early attempts to quantify population characteristics. Today, it encompasses a wide range of methods and techniques for data analysis. The field has become increasingly important in the digital age, where organizations collect vast amounts of data and seek to extract actionable insights.
The fundamental goal of statistics is to reduce complex, large datasets into manageable summaries that communicate essential information. This process transforms raw data into knowledge that can guide strategic planning, risk assessment, and performance evaluation. Statistics bridges the gap between pure mathematics and practical application, making it indispensable for professionals across all sectors.
The Two Main Types of Statistics
Statistics can be broadly divided into two main categories: descriptive statistics and inferential statistics. Each type serves different purposes and employs distinct methodologies.
Descriptive Statistics
Descriptive statistics focuses on summarizing and describing the characteristics of a dataset. This type of statistics involves collecting data from an entire population or a representative sample and using various methods to organize, display, and summarize that information.
Key components of descriptive statistics include:
- Measures of Central Tendency: These include the mean (average), median (middle value), and mode (most frequently occurring value). These measures help identify the “typical” or central value within a dataset.
- Measures of Dispersion: These metrics—such as standard deviation, variance, and range—indicate how spread out the data is from the center. They help assess variability within a dataset.
- Data Visualization: Charts, graphs, histograms, and other visual representations make it easier to understand patterns and trends at a glance.
- Frequency Distributions: These show how often different values appear in a dataset, providing insight into data patterns.
Descriptive statistics are particularly useful when working with large datasets, as they condense information into understandable summaries. Financial analysts use descriptive statistics to report on stock performance, portfolio returns, and market trends.
Inferential Statistics
Inferential statistics, by contrast, involves using sample data to make predictions or inferences about a larger population. Rather than describing only the data at hand, inferential statistics attempts to generalize findings and test hypotheses.
Key aspects of inferential statistics include:
- Hypothesis Testing: This involves formulating a hypothesis about a population and using sample data to test its validity.
- Confidence Intervals: These provide a range of values within which a population parameter is likely to fall, along with a confidence level (e.g., 95% confident).
- Regression Analysis: This technique examines relationships between variables, allowing predictions about one variable based on others.
- Sampling Methods: Inferential statistics relies on proper sampling techniques to ensure that conclusions drawn from sample data are valid for the broader population.
Inferential statistics is essential for market research, clinical trials, quality control, and many other applications where drawing conclusions about large populations from smaller samples is necessary.
Key Statistical Measures and Metrics
Understanding essential statistical measures is vital for effective data analysis. Here are the most commonly used metrics:
| Statistical Measure | Definition | Use Case |
|---|---|---|
| Mean | The average of all values in a dataset | Determining average portfolio returns or customer spending |
| Median | The middle value when data is arranged in order | Finding typical home prices or income levels (less affected by outliers) |
| Mode | The most frequently occurring value | Identifying popular product choices or common customer preferences |
| Standard Deviation | A measure of how spread out data is from the mean | Assessing investment risk or product consistency |
| Variance | The square of the standard deviation | Comparing variability between different datasets |
| Range | The difference between the highest and lowest values | Identifying the span of possible outcomes |
Applications of Statistics in Finance and Business
Statistics plays an indispensable role in the financial industry and broader business landscape. Here are key applications:
Investment Analysis
Financial analysts use statistical methods to evaluate investment opportunities, assess risk, and optimize portfolios. Techniques such as correlation analysis, regression models, and Monte Carlo simulations help investors understand asset relationships and predict future performance. Value at Risk (VaR) calculations employ statistical methods to estimate potential losses in investment portfolios.
Market Research
Companies use statistics to understand consumer behavior, market trends, and competitive positioning. Survey sampling, statistical testing, and data analysis help organizations identify customer preferences, measure brand awareness, and evaluate marketing effectiveness.
Quality Control
Manufacturing and service industries use statistical process control to maintain product and service quality. Control charts, acceptance sampling, and process capability analysis help organizations identify defects and improve operational efficiency.
Risk Management
Banks and insurance companies rely heavily on statistical modeling to assess credit risk, price insurance products, and manage operational risks. Statistical techniques help quantify uncertainty and inform risk mitigation strategies.
Human Resources
HR departments use statistics for salary benchmarking, employee performance analysis, retention rate calculations, and workforce planning. Statistical methods help organizations make data-driven decisions about compensation, hiring, and organizational development.
Statistical Methods and Techniques
Modern statistics employs various sophisticated methods and techniques:
- Probability Distributions: Understanding normal distributions, binomial distributions, and other probability models is fundamental to statistical analysis.
- Correlation and Regression: These techniques measure relationships between variables and help predict outcomes based on known variables.
- Time Series Analysis: Used to analyze data collected over time, identifying trends, cycles, and seasonal patterns.
- Factor Analysis: Reduces complex datasets to identify underlying factors or dimensions.
- Cluster Analysis: Groups similar observations together, useful for customer segmentation and market classification.
- Bayesian Methods: Incorporate prior knowledge with observed data to make probabilistic inferences.
The Importance of Data Quality in Statistics
The reliability of statistical analysis depends fundamentally on data quality. Garbage in, garbage out (GIGO) is a principle that emphasizes how poor-quality data leads to flawed conclusions. Ensuring data accuracy, completeness, consistency, and relevance is essential for producing valid statistical insights.
Data validation processes, outlier detection, and careful sampling design all contribute to improving data quality. Organizations must establish strong data governance practices to maintain the integrity of their statistical analyses and the decisions based upon them.
Common Challenges in Statistical Analysis
While statistics is powerful, analysts face several common challenges:
- Sampling Bias: Non-representative samples can lead to skewed conclusions that don’t reflect the broader population.
- Confounding Variables: Multiple factors influencing outcomes can make it difficult to isolate specific effects.
- Misinterpretation: Statistical results can be misunderstood or misrepresented, especially when communicated to non-technical audiences.
- p-Hacking: Testing multiple hypotheses without proper corrections can lead to false discoveries.
- Correlation vs. Causation: Finding a statistical relationship between variables doesn’t necessarily imply that one causes the other.
Statistics in the Digital Age
The explosion of data in recent years has transformed the role of statistics. Big data analytics, machine learning, and artificial intelligence all rely on statistical principles. Advanced computing power has made sophisticated statistical techniques accessible and practical for analyzing massive datasets.
Data science, which combines statistics with computer science and domain expertise, has emerged as a critical field in modern organizations. Statistical literacy—the ability to understand and interpret statistical information—has become an essential skill for professionals across industries.
Frequently Asked Questions
What is the difference between population and sample statistics?
Population statistics describe an entire population of interest, while sample statistics are derived from a subset of that population. Sample statistics serve as estimates of population parameters, allowing analysts to make inferences about larger groups without analyzing every individual element.
Why is standard deviation important?
Standard deviation measures the variability of data around the mean. In finance, it serves as a proxy for investment risk—higher standard deviation indicates greater volatility. Understanding standard deviation helps investors assess how much returns might fluctuate around expected values.
How do statisticians determine sample size?
Sample size is determined using statistical formulas that consider the desired confidence level, margin of error, and population variability. Power analysis helps ensure samples are large enough to detect meaningful effects while avoiding unnecessarily large samples that waste resources.
What does a p-value represent?
A p-value indicates the probability of observing results as extreme as those found, assuming the null hypothesis is true. A lower p-value (typically below 0.05) suggests stronger evidence against the null hypothesis, supporting the alternative hypothesis.
Can statistics prove causation?
Statistics alone cannot definitively prove causation. While correlation can be demonstrated statistically, establishing causation typically requires experimental design or careful consideration of confounding variables. Even with statistical relationships, domain expertise is needed to interpret meaning.
How are statistics used in artificial intelligence and machine learning?
Machine learning algorithms are fundamentally rooted in statistical principles. Regression models, classification algorithms, and neural networks all employ statistical techniques to identify patterns and make predictions. Statistical methods validate model performance and assess prediction accuracy.
References
- An Introduction to Statistical Learning — James, Witten, Hastie, Tibshirani. Springer Publishing. 2021. https://www.statlearning.com/
- Guidelines for Statistical Reporting — American Statistical Association. 2023. https://www.amstat.org/
- Statistics and Probability — National Institute of Standards and Technology (NIST). 2024. https://www.nist.gov/
- The Elements of Statistical Learning: Data Mining, Inference, and Prediction — Hastie, Tibshirani, Friedman. Springer Publishing. 2009. https://web.stanford.edu/~hastie/ElemStatLearn/
- Statistical Methods for Quality Improvement — ASQC Quality Press. 2022. https://asq.org/
This article is general information, not personal financial advice. Consider your own situation, or speak with a licensed adviser, before acting on it.


