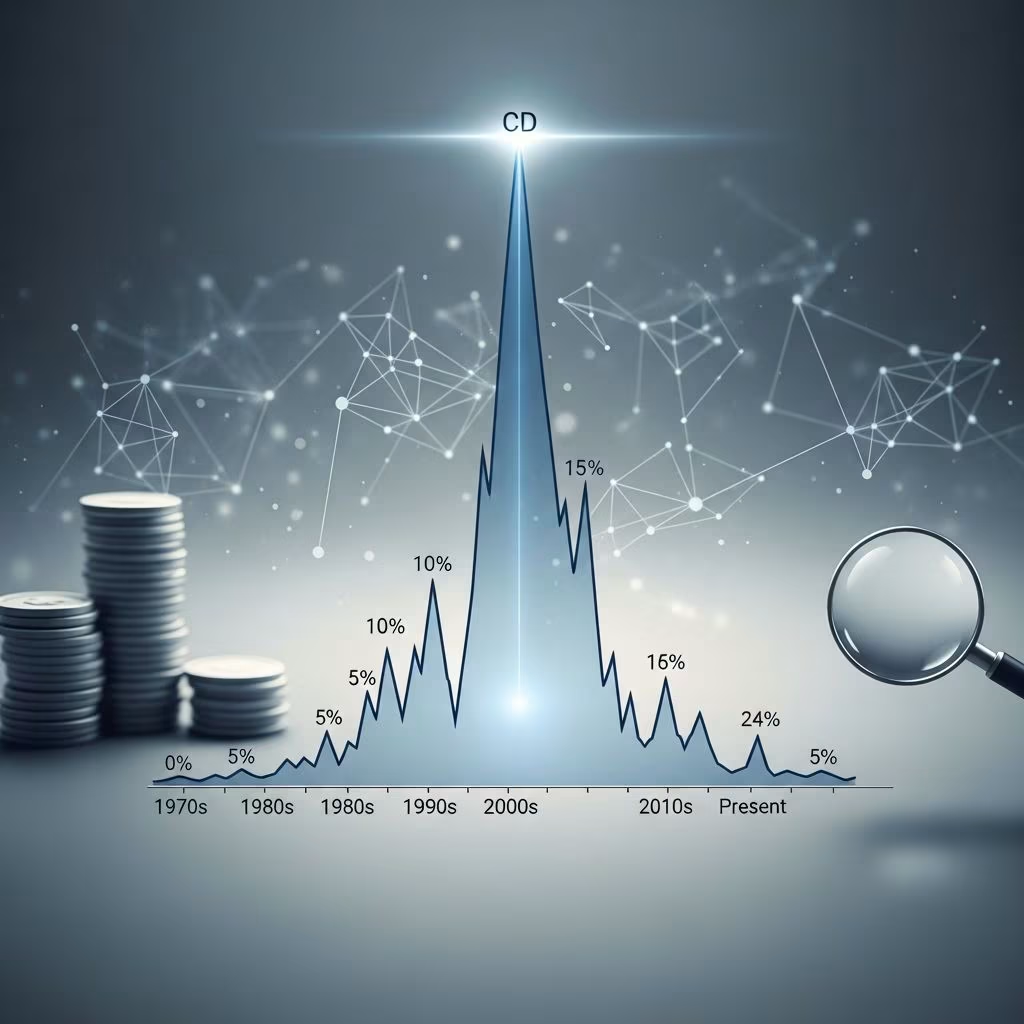
Certificates of deposit (CDs) have long served as a cornerstone of conservative saving strategies, offering fixed returns over set periods. Their yields have mirrored broader economic tides, surging during inflationary booms and dipping in recessionary lulls. This article delves into four decades of CD rate evolution, highlighting pivotal shifts and the forces behind them.
The Explosive 1980s: Double-Digit Returns
The 1980s marked the zenith of CD yields, fueled by aggressive Federal Reserve policies to combat rampant inflation. In December 1980, three-month CDs averaged an astonishing 18.65% APY, the highest recorded in modern history. Short-term options hovered between 15% and 18% throughout 1980-1981, while longer terms like five-year CDs delivered 12% to 14% APY.
These peaks stemmed from Fed Chair Paul Volcker’s bold rate hikes, pushing the federal funds rate above 20% to tame double-digit inflation. Banks competed fiercely, passing elevated yields to depositors. By mid-decade, rates moderated but stayed robust: three-month CDs averaged 13.39% in early 1980, easing to 7.80% by 1985 amid two recessions, and closing at 8.32% in 1989. Even late-1980s lows around 5.69% dwarfed today’s figures.
- Key drivers: High inflation, Volcker’s tight monetary policy.
- Investor appeal: CDs outshone riskier assets like stocks during volatility.
- Term variations: Shorter CDs often led with higher rates due to liquidity demands.
1990s Turbulence: From Lows to Modest Rebounds
The 1990s brought dramatic swings as the economy transitioned from recession to tech-fueled growth. Rates plunged to a decade low of 2.66% by 1992, down sharply from 10.39% in 1991. A brief uptick followed, reaching 6% by July 1995, before Fed easing pulled them back to 3.99% by century’s end.
Early decade weakness reflected post-recession caution, with the Fed prioritizing recovery. Mid-1990s hikes countered emerging inflation, benefiting savers temporarily. Six-month CDs averaged 6.59% over the decade, underscoring relative stability despite fluctuations.
| Year | 3-Month CD Avg APY | Key Event |
|---|---|---|
| 1991 | 10.39% | Recession recovery |
| 1992 | 2.66% | Historic low |
| 1995 | ~6% | Inflation response |
| 1999 | 3.99% | Dot-com buildup |
This era taught savers the value of monitoring Fed signals, as policy pivots directly swayed yields.
2000s Decline: Dot-Com Bust and Great Recession
The new millennium ushered in falling rates amid economic shocks. Post-dot-com bubble, the Fed slashed rates to stimulate growth, dropping one-year CD yields below 2% APY by 2002. Six-month CDs averaged 6.59% early on but cratered to 3.66% in 2001, 1.81% in 2002, and 1.71% in 2003.
The 2007-2009 financial crisis accelerated the slide, with six-month rates hitting 3.14%. Banks hoarded liquidity, compressing deposit yields. By decade’s end, savers faced paltry returns, prompting shifts to stocks or bonds.
- Economic triggers: Tech crash, housing bubble burst.
- Fed response: Near-zero federal funds rate from 2008.
- Long-term impact: CDs lost luster as inflation eroded real returns.
2010s Stagnation: Near-Zero Yields Dominate
The 2010s epitomized low-rate misery. From 2009-2015, Fed near-zero policies kept one-year CDs between 0.20% and 1% APY. Three-month rates started at 0.22% in 2010, inching to 1.79% by 2019, while 12-month options languished under 1%, peaking at 2.68% in 2018. Five-year CDs topped 1.22% briefly in 2018-2019.
June 2013 saw one-year CDs at 0.24% and five-year at 0.77%. Gradual 2015-2018 hikes offered minor relief, but yields remained historically depressed. This period highlighted CDs’ safety amid stock volatility but underscored opportunity costs.
2020s Rollercoaster: Pandemic Lows to Inflation-Fueled Peaks
COVID-19 initially drove rates lower, with all terms below 1% APY. The Fed’s emergency cuts prioritized crisis response. Inflation’s 2021 surge prompted 11 hikes in 2022-2023, igniting a CD renaissance.
By October 2022, 12-month, three-year, and five-year CDs exceeded 1% for the first time since 2011. Mid-2023 peaks hit 1.72% for 12-month and 1.37% for five-year. Online banks pushed one-year rates to 4.50%-5.50% and five-year to 4%-5%. APYs crested late 2023 before Fed cuts in 2024-2025 tempered them.
As of March 2026, national average one-year CD yields stand at 1.9% APY, with top offers at 4.1%; five-year averages 1.68%. Shorter terms now outpace longer ones due to an inverted yield curve signaling caution.
Factors Shaping CD Rate Movements
CD yields track the federal funds rate indirectly, as banks adjust deposit rates to fund loans. Inflation spikes prompt hikes; recessions trigger cuts.
- Fed Policy: Primary driver, with 2022-2023 hikes mirroring 1980s aggression.
- Economic Cycles: Booms boost rates; downturns suppress them.
- Bank Competition: Online institutions often lead with superior APYs.
- Yield Curve: Inverted curves favor short-term CDs.
Term Length Comparisons Over Time
| Decade | 3-Month Avg | 12-Month Avg | 5-Year Avg |
|---|---|---|---|
| 1980s | ~10-18% | ~11% | 12-14% |
| 1990s | ~4-6% | ~5% | ~5% |
| 2000s | ~2-4% | <2% | ~3% |
| 2010s | <1% | 0.2-1% | <1.2% |
| 2020s (peak) | ~5% | 4.5-5.5% | 4-5% |
Data synthesized from historical averages.
Strategic Insights for Savers
Historical patterns reveal opportunities: Lock in rates during ascent phases. Current environment favors short-term CDs amid potential further cuts. Diversify with CD ladders to balance liquidity and yield.
- Laddering: Stagger maturities for steady access.
- Shop competitively: Online banks beat national averages.
- Watch inflation: Real yields matter most.
FAQs
What were the highest CD rates ever?
Three-month CDs peaked at 18.65% APY in December 1980.
Why do CD rates change?
They respond to Fed funds rate adjustments, inflation, and economic health.
Are CD rates high now in 2026?
Averages are 1.9% for one-year, with tops at 4.1%, down from 2023 peaks but above 2010s lows.
Should I buy CDs today?
Ideal for risk-averse savers if rates exceed inflation; compare to high-yield savings.
How does term length affect rates?
Typically longer terms pay more, but inversions make short terms attractive now.
References
- The Evolution Of CD Rates: 44 Years Of Data (1980-2024) — Hedge Fund Alpha. 2024. https://hedgefundalpha.com/research/historical-cd-interest-rates/
- Historical CD Rates: How They Have Changed — GOBankingRates. 2023. https://www.gobankingrates.com/banking/cd-rates/historical-cd-rates/
- Historical CD Interest Rates 1984-2025 — Bankrate. 2026-01-18. https://www.bankrate.com/banking/cds/historical-cd-interest-rates/
- Historical CD Rates 1980-2025: Highs, Lows and the Stories Behind — NerdWallet. 2025. https://www.nerdwallet.com/banking/learn/historical-cd-rates
- Certificates of Deposit — Federal Reserve Bank of St. Louis (FRED). Ongoing. https://fred.stlouisfed.org/categories/121
- National Rates and Rate Caps – Previous Rates — FDIC. Ongoing. https://www.fdic.gov/national-rates-and-rate-caps/national-rates-and-rate-caps-previous-rates
This article is general information, not personal financial advice. Consider your own situation, or speak with a licensed adviser, before acting on it.