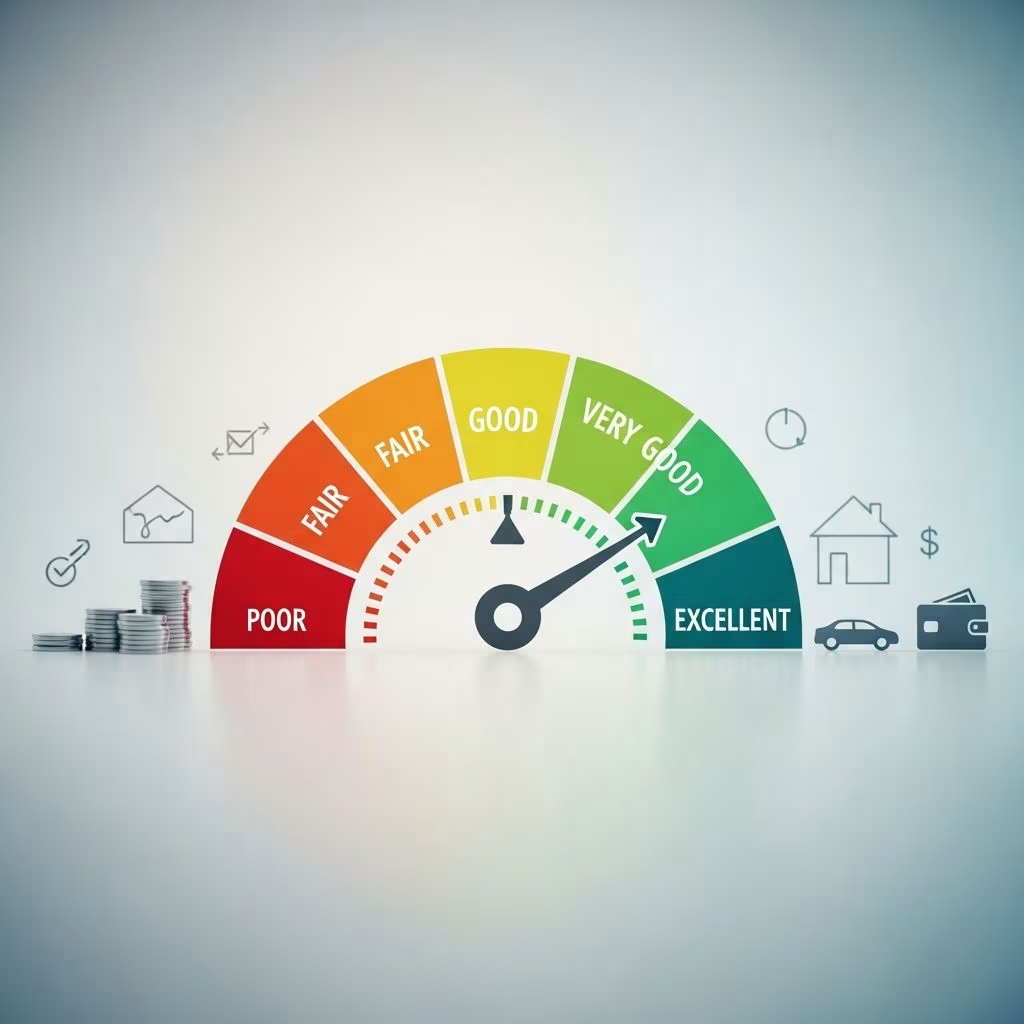
Credit scores serve as numerical summaries of your creditworthiness, typically spanning from 300 to 850 in most models, helping lenders assess risk when offering loans or credit cards. Higher scores correlate with lower default risk, unlocking favorable interest rates and terms, while lower ones signal caution to creditors.
Why Credit Score Categories Matter
Lenders categorize scores into tiers like poor, fair, good, very good, and exceptional to standardize evaluations across applicants. These ranges guide decisions on approvals, rates, and limits; for instance, exceptional scores often qualify for prime offers, whereas poor ratings may lead to denials or high-cost options. Understanding your position empowers proactive financial management.
Standard FICO Score Ranges
FICO Scores, developed by Fair Isaac Corporation, dominate lending decisions with a 300-850 scale. The categories break down as follows:
| Category | Score Range | Implications |
|---|---|---|
| Poor | 300-579 | High risk; limited approvals, high rates if approved |
| Fair | 580-669 | Subprime; some access but elevated costs |
| Good | 670-739 | Acceptable risk; standard rates and terms |
| Very Good | 740-799 | Strong profile; competitive offers |
| Exceptional | 800-850 | Lowest risk; best rates and perks |
As of recent data, the U.S. average FICO Score hovers around 715, placing most in the good range.
VantageScore Categories Compared
VantageScore, a competitor model from the three major bureaus, also uses 300-850 but adjusts category boundaries slightly. Key differences include:
- Very Poor: 300-499 (stricter low end than FICO’s poor)
- Poor: 500-600
- Fair: 601-660
- Good: 661-780 (broader than FICO)
- Excellent: 781-850
These variations mean a score might classify as good in one model but fair in another, affecting lender perceptions.
Variations in Industry-Specific Models
Beyond base scores, FICO offers tailored versions like auto or bankcard scores ranging 250-900 to better predict behavior in specific sectors. Such models refine risk for niche lending, potentially shifting your effective rating.
Core Factors Driving Your Score
Scores derive from credit report data, weighted by five elements in FICO models.
| Factor | Weight | Description |
|---|---|---|
| Payment History | 35% | On-time payments build trust; delinquencies harm significantly |
| Amounts Owed | 30% | Keep utilization under 30% of limits |
| Length of History | 15% | Longer, seasoned accounts boost reliability |
| New Credit | 10% | Avoid multiple inquiries; space applications |
| Credit Mix | 10% | Diverse accounts (e.g., cards, loans) demonstrate versatility |
Payment history reigns supreme, as even one late payment can drop scores markedly.
Real-World Impacts by Score Tier
Poor Credit (300-579)
This range signals severe issues like delinquencies or bankruptcy, restricting options to high-interest subprime lenders. Approval odds plummet, and terms burden budgets.
Fair Credit (580-669)
Subprime territory offers basic access but at premiums; average scores fall here for many. Building habits can elevate quickly.
Good Credit (670-739)
A solid benchmark for most approvals with reasonable rates; 670+ is lender-friendly.
Very Good and Exceptional (740+)
Prime status yields top-tier deals, rewards, and leverage in negotiations. About 39% of 40-49 year-olds hit superprime.
Average Scores Across Demographics
Nationally, 2023-2025 averages sit at 715 for FICO, with good-to-excellent dominating. Younger borrowers trend lower due to thin files, improving with age and experience. Roughly one-third hold 600-750, 48% above.
Strategies to Elevate Your Score
- Pay on time: Automate bills to protect the 35% factor.
- Reduce debt: Target under 30% utilization across cards.
- Retain old accounts: Preserve history length.
- Limit applications: Inquiries ding temporarily.
- Diversify wisely: Add installment loans if needed.
Monitor via free weekly reports from AnnualCreditReport.com and dispute errors promptly.
Common Myths and Realities
Myths persist: closing cards doesn’t help (it may hike utilization); checking your score isn’t an inquiry. Scores refresh monthly, reflecting recent activity.
FAQs
What is a good credit score in 2026?
For 300-850 scales, 670-739 qualifies as good per FICO; 661-780 for VantageScore. Averages near 715.
Why do my scores differ across bureaus?
Variations stem from report differences, model versions, and timing.
What’s the maximum score possible?
850 in standard models; industry ones reach 900.
How long to improve from poor to good?
3-6 months with consistent habits, longer for major issues.
Do all lenders use the same ranges?
No, some set custom thresholds atop models.
Monitoring and Next Steps
Regular checks via services like Experian or banks keep you informed. Aim for 740+ for optimal benefits in mortgages, autos, and cards.
References
- What Are the Different Credit Score Ranges? — Experian. 2023. https://www.experian.com/blogs/ask-experian/infographic-what-are-the-different-scoring-ranges/
- Credit Score Ranges & What They Mean — Chase. 2025-01-15. https://www.chase.com/personal/credit-cards/education/credit-score/credit-score-ranges-and-what-they-mean
- What are the Different Ranges of Credit Scores? — Equifax. 2024-06-10. https://www.equifax.com/personal/education/credit/score/articles/-/learn/credit-score-ranges/
- Understanding Credit Scores: What Affects Your Score — INSZONE Insurance. 2025-02-20. https://inszoneinsurance.com/blog/understanding-credit-scores
- What Is a Good Credit Score? — Experian. 2024-11-05. https://www.experian.com/blogs/ask-experian/credit-education/score-basics/what-is-a-good-credit-score/
This article is general information, not personal financial advice. Consider your own situation, or speak with a licensed adviser, before acting on it.