

What Is a Demand Curve?
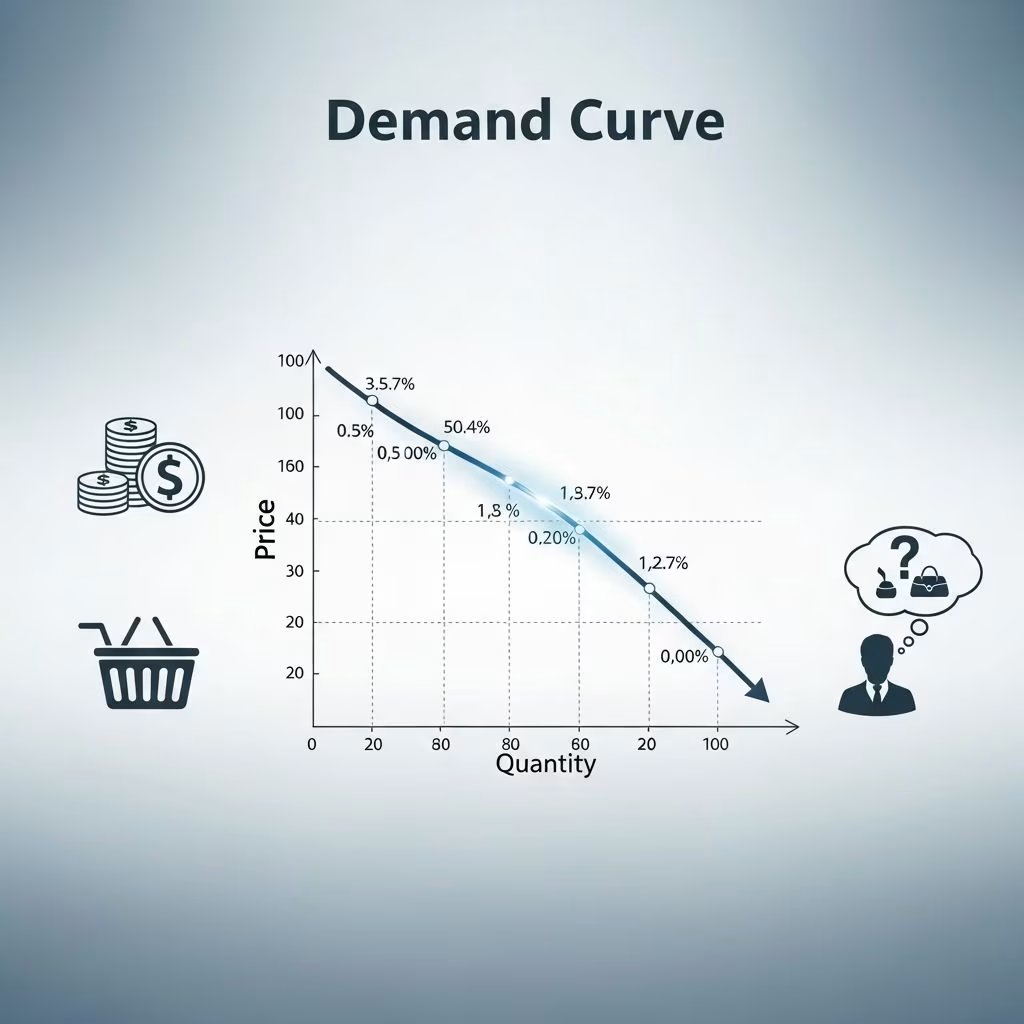
A demand curve is a graphical representation that illustrates the relationship between the price of a good or service and the quantity of that good or service that consumers are willing to purchase at various price levels. In economics, the demand curve is one of the most fundamental concepts for understanding how markets function and how price changes influence consumer purchasing behavior. The demand curve typically slopes downward from left to right, demonstrating the inverse relationship between price and quantity demanded—as prices decrease, consumers tend to purchase larger quantities, and as prices increase, the quantity demanded decreases.
The demand curve is derived from the law of demand, which states that, all else being equal, there is an inverse relationship between the price of a good and the quantity demanded. This principle has been observed consistently across various markets and economies, making it a cornerstone of economic theory and market analysis.
Understanding the Demand Curve
The demand curve serves as a critical tool for economists, business analysts, and policymakers to predict consumer behavior and market outcomes. By plotting various price points on the vertical axis and corresponding quantities demanded on the horizontal axis, the demand curve provides a visual representation of how market demand responds to price changes.
Key characteristics of a demand curve include:
- Negative Slope: The downward slope reflects the inverse relationship between price and quantity demanded
- Individual vs. Market Demand: An individual demand curve shows one consumer’s purchasing behavior, while a market demand curve aggregates the demand of all consumers in a market
- Price Elasticity: The steepness of the demand curve reflects the price elasticity of demand—how responsive consumers are to price changes
- Ceteris Paribus: The demand curve assumes all other factors remain constant, focusing solely on the relationship between price and quantity
The Demand Curve Equation
The demand curve can be expressed mathematically as a linear equation, typically written as:
Qd = a – b(P)
Where:
- Qd = Quantity Demanded
- a = The quantity demanded when price is zero (y-intercept)
- b = The slope of the demand curve (shows how much quantity changes with each unit price change)
- P = Price of the good or service
This linear representation allows economists and businesses to calculate precise relationships between price changes and quantity demanded, enabling more accurate forecasting and pricing strategies.
Movement Along vs. Shift of the Demand Curve
It’s crucial to distinguish between movement along the demand curve and a shift of the entire demand curve, as these represent different economic phenomena:
Movement Along the Demand Curve
Movement along the demand curve occurs when the price of the good changes, resulting in a change in the quantity demanded while the demand curve itself remains stationary. This movement reflects a change in quantity demanded due to price changes alone. For example, if the price of coffee increases from $3 to $4 per cup, consumers might reduce their quantity demanded from 100 cups to 80 cups per day, moving upward along the existing demand curve.
Shift of the Demand Curve
A shift of the demand curve occurs when factors other than price change, causing the entire demand curve to move. This represents a change in demand itself. An increase in demand shifts the curve to the right, meaning more quantity is demanded at each price level, while a decrease in demand shifts the curve to the left. A shift might occur due to changes in consumer preferences, income levels, or the availability of substitute goods.
Factors That Shift the Demand Curve
Several factors can cause the demand curve to shift, representing changes in overall market demand:
- Consumer Income: When consumer income increases, demand for normal goods typically increases, shifting the curve rightward. Conversely, for inferior goods, increased income leads to decreased demand
- Consumer Preferences: Changes in tastes and preferences can significantly affect demand. Fashion trends, health consciousness, or cultural shifts can alter consumer purchasing patterns
- Prices of Related Goods: The prices of substitute goods and complementary goods influence demand. If substitute goods become cheaper, demand for the original good decreases. If complementary goods become cheaper, demand for the original good increases
- Number of Consumers: Population growth or changes in the target market size directly affect market demand
- Future Price Expectations: If consumers expect prices to increase in the future, current demand may increase. Conversely, expected price decreases may reduce current demand
- Advertising and Marketing: Promotional activities can shift consumer preferences and increase demand for a product
- Seasonal Factors: Demand for certain products fluctuates seasonally, reflecting holidays, weather changes, and cultural events
Price Elasticity of Demand
Price elasticity of demand measures the responsiveness of quantity demanded to changes in price. It’s calculated as the percentage change in quantity demanded divided by the percentage change in price. The elasticity of a demand curve determines how steep or flat the curve appears:
- Elastic Demand: When elasticity is greater than 1, demand is elastic, meaning consumers are highly responsive to price changes. The demand curve appears relatively flat
- Inelastic Demand: When elasticity is less than 1, demand is inelastic, indicating consumers are less responsive to price changes. The demand curve appears steeper
- Unit Elastic: When elasticity equals 1, a percentage change in price leads to an equal percentage change in quantity demanded
Understanding price elasticity helps businesses determine optimal pricing strategies. Products with elastic demand may benefit from lower prices to increase total revenue, while products with inelastic demand can sustain higher prices with minimal quantity reduction.
Real-World Examples of Demand Curves
Gasoline Market
The gasoline market demonstrates relatively inelastic demand. When gas prices rise, consumers don’t significantly reduce consumption because driving is often essential. However, extremely high prices may eventually reduce demand as consumers adapt by using public transportation or purchasing fuel-efficient vehicles.
Coffee and Specialty Beverages
The coffee market shows relatively elastic demand, particularly for specialty coffee. When prices at premium coffee shops increase, consumers may switch to cheaper alternatives or prepare coffee at home. This elasticity reflects available substitutes and discretionary nature of specialty beverages.
Pharmaceutical Products
Demand for essential medications is highly inelastic. Patients requiring specific medications typically continue purchasing them regardless of price increases because the alternatives—not taking medication—pose health risks. This inelasticity explains why pharmaceutical companies can maintain relatively high prices.
The Demand Curve in Different Market Structures
The demand curve takes different forms depending on the market structure:
- Perfect Competition: Individual firms face perfectly elastic demand (horizontal line), while the market demand curve slopes downward
- Monopoly: The monopolist faces the entire market demand curve, which typically slopes downward
- Oligopoly: Firms face kinked demand curves, reflecting complex competitive dynamics
- Monopolistic Competition: Firms face slightly downward-sloping demand curves, reflecting product differentiation
Practical Applications of Demand Curves
Business Pricing Strategy
Companies use demand curves to determine optimal pricing by analyzing where marginal revenue equals marginal cost. This analysis helps maximize profit margins while maintaining competitiveness.
Revenue Forecasting
By understanding their demand curve, businesses can forecast revenues at different price points and production levels, enabling better financial planning.
Market Research
Demand curves inform market research by highlighting consumer preferences and price sensitivity, guiding product development and positioning decisions.
Government Policy
Policymakers use demand curves to predict the effects of taxes, subsidies, and price controls on markets, helping them design effective economic policies.
Limitations of the Demand Curve
While demand curves are valuable analytical tools, they have limitations:
- Ceteris Paribus Assumption: Demand curves assume all other factors remain constant, which rarely occurs in real markets
- Simplification: Real consumer behavior is complex and influenced by psychological factors not captured in simple demand curves
- Data Requirements: Accurate demand curves require extensive historical data and careful analysis
- Dynamic Markets: In rapidly changing markets, historical demand curves may not predict future behavior accurately
Frequently Asked Questions (FAQs)
Q: Why does a demand curve typically slope downward?
A: The downward slope reflects the law of demand, which states that as prices increase, consumers demand less quantity, and as prices decrease, consumers demand more. This inverse relationship occurs because higher prices reduce purchasing power and consumers substitute toward cheaper alternatives.
Q: What is the difference between a change in demand and a change in quantity demanded?
A: A change in quantity demanded refers to movement along the demand curve caused by price changes. A change in demand refers to the entire demand curve shifting due to non-price factors like income, preferences, or the number of consumers.
Q: How does income affect the demand curve?
A: For normal goods, increased income shifts the demand curve rightward (higher demand at each price), while decreased income shifts it leftward. For inferior goods, the relationship is reversed.
Q: Can a demand curve be upward-sloping?
A: While rare, upward-sloping demand curves exist for Giffen goods and Veblen goods. Giffen goods are inferior goods where income effects outweigh substitution effects. Veblen goods are luxury items where higher prices increase demand due to status considerations.
Q: How do businesses use demand curves practically?
A: Businesses use demand curves for pricing optimization, revenue forecasting, inventory management, and competitive positioning. They analyze elasticity to determine how price changes affect sales volume and total revenue.
Q: What is price elasticity of demand and why does it matter?
A: Price elasticity of demand measures how responsive consumers are to price changes. It matters because it helps businesses understand whether price increases will increase or decrease total revenue, informing pricing strategy decisions.
References
- Principles of Microeconomics — Federal Reserve Education System. 2023. https://www.federalreserveeducation.org/
- Demand Elasticity and Market Structure — Organisation for Economic Co-operation and Development (OECD). 2024. https://www.oecd.org/
- Consumer Behavior and Price Response — Bureau of Labor Statistics, U.S. Department of Labor. 2025. https://www.bls.gov/
- Market Demand Analysis — International Monetary Fund (IMF). 2024. https://www.imf.org/
- Pricing Strategy and Demand Curves — American Economic Association. 2024. https://www.aeaweb.org/
This article is general information, not personal financial advice. Consider your own situation, or speak with a licensed adviser, before acting on it.


