

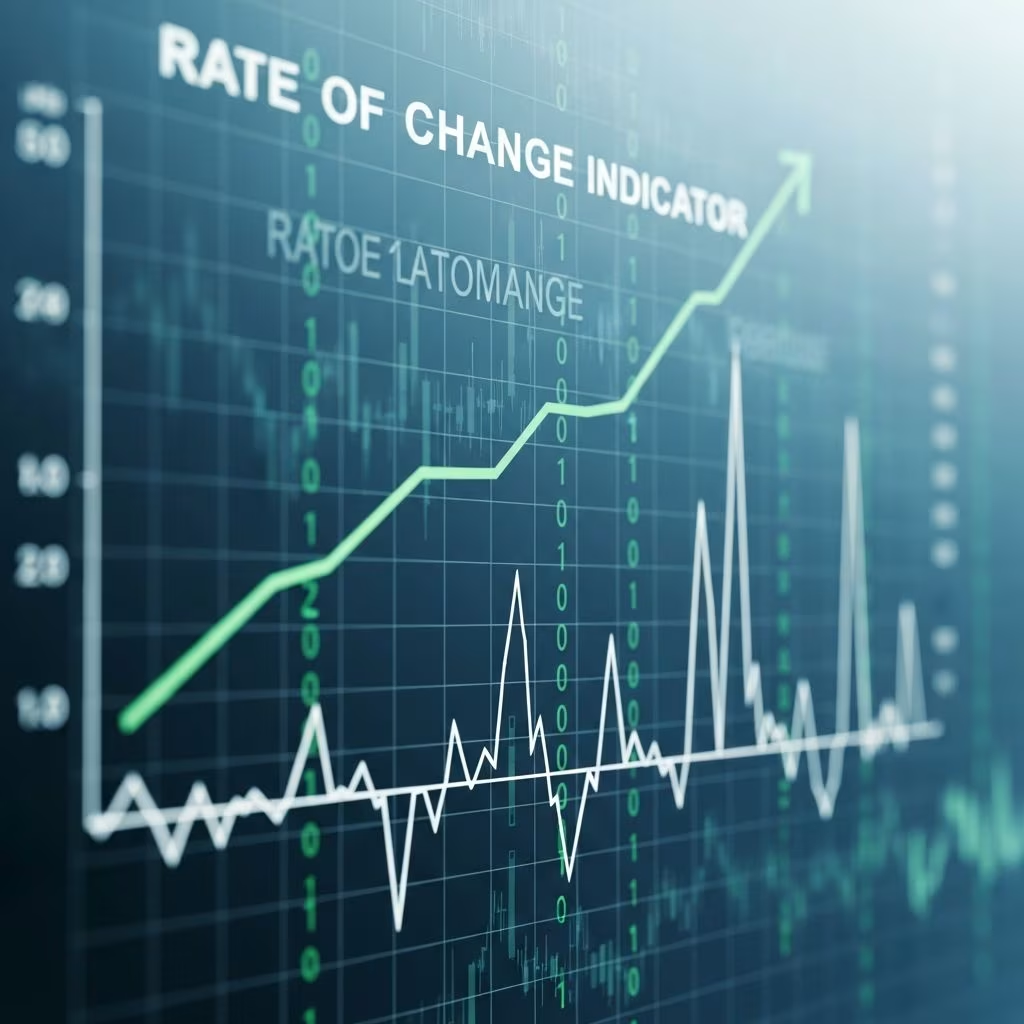
The Rate of Change (ROC) indicator is a fundamental momentum oscillator in technical analysis that quantifies the percentage shift in an asset’s price over a specified period, aiding traders in assessing the speed and direction of price movements.
Understanding Momentum in Financial Markets
Momentum indicators like ROC help investors gauge whether an asset’s price is accelerating upward or decelerating into a potential decline. By comparing current prices to historical ones, ROC reveals the velocity of change, distinguishing it from simple price direction tools.
In volatile markets, recognizing momentum shifts can prevent entering trades too late or exiting prematurely. ROC oscillates around a zero line, where positive values signal upward momentum and negative ones indicate downward pressure.
Core Formula and Calculation Process
The ROC formula is straightforward: ROC = [(Current Closing Price – Closing Price n Periods Ago) / Closing Price n Periods Ago] × 100.
To compute it step-by-step:
- Identify the current closing price of the asset.
- Select a lookback period (n), commonly 10, 14, or 20 days for daily charts.
- Retrieve the closing price from n periods prior.
- Subtract the past price from the current price.
- Divide the difference by the past price.
- Multiply by 100 for percentage representation.
For instance, if a stock closes at $150 today and $120 ten days ago, ROC = [($150 – $120) / $120] × 100 = 25%. This 25% reading shows robust upward momentum.
Interpreting ROC Readings
ROC values provide clear insights into market dynamics:
- Positive ROC: Above zero indicates rising prices; higher values suggest accelerating gains.
- Negative ROC: Below zero signals falling prices; steeper negatives point to rapid declines.
- Zero Line Crossovers: Moving above zero confirms bullish shifts, while dipping below warns of bearish turns.
Extreme readings flag overbought (high positive) or oversold (deep negative) conditions, though assets can persist in these states during strong trends.
ROC as a Trend Strength Gauge
ROC excels at measuring trend vigor. Sustained positive readings above zero affirm an uptrend’s health, while fading positives may signal weakening.
In downtrends, deepening negative ROC underscores selling pressure. Traders monitor ROC expansion: surging positives during advances or plunging negatives in declines highlight momentum intensification.
| ROC Range | Interpretation | Action Insight |
|---|---|---|
| > +10% | Strong uptrend acceleration | Consider long positions |
| 0 to +10% | Moderate upward momentum | Monitor for continuation |
| 0 to -10% | Moderate downward pressure | Watch for support levels |
| < -10% | Strong downtrend | Potential short opportunities |
Leveraging Divergences for Reversal Signals
Divergences occur when price and ROC move oppositely, often preceding reversals. Bullish divergence: price makes lower lows, but ROC forms higher lows, hinting at building upside momentum.
Bearish divergence: price hits higher highs while ROC shows lower highs, indicating fading bullish strength.
Combine ROC with RSI or MACD for confirmation, as isolated divergences can mislead in sharp trends.
Integrating ROC with Other Technical Tools
ROC shines in multi-indicator strategies:
- With Moving Averages: Positive ROC crossing a rising MA supports buy signals.
- Volume Confirmation: High volume alongside positive ROC validates trends.
- Support/Resistance: ROC extremes near key levels enhance breakout reliability.
Avoid standalone use; ROC’s unbounded upside (no cap on positives) contrasts its -100% floor, making context essential.
Practical Trading Applications
Day traders favor short periods (e.g., 5-10) for quick signals, while swing traders use 20-50 for broader trends.
Example strategy: Enter long when ROC crosses above zero with bullish candlestick confirmation; exit on negative crossover or divergence.
Backtesting reveals ROC’s edge in trending markets but whipsaws in ranges—pair with ADX for trend filters.
Common Pitfalls and Best Practices
Watch for:
- Overreliance on Extremes: Oversold/overbought can endure in trends.
- Lag in Choppy Markets: Shorten periods or add filters.
- Period Selection: Test via optimization; no universal best.
Best practices: Use multiple timeframes (e.g., 125-day and 250-day ROC for long-term views) and maintain risk management.
Advanced Variations and Customizations
Smoothed ROC applies EMAs to reduce noise. Multi-ROC overlays (short/long periods) spot confluences signaling major shifts.
In forex or crypto, adjust for 24/7 trading with hourly/daily n values.
FAQs
What does a zero ROC mean?
A zero ROC indicates no net price change over the period—prices are flat.
Is ROC leading or lagging?
ROC is lagging as it uses historical data but leads in signaling momentum shifts via divergences.
Best ROC period for stocks?
14 periods is common, but optimize per asset and timeframe.
Can ROC predict crashes?
Deep negative ROC warns of declines but doesn’t forecast crashes alone—use with volume and news.
ROC vs. Momentum Indicator?
They are identical; Momentum is another name for ROC.
References
- Rate of change (ROC): Definition, formula & how to calculate it — One Money Way. 2023. https://onemoneyway.com/en/dictionary/rate-of-change/
- Rate of Change (ROC) — Fidelity Investments. 2024-02-01. https://www.fidelity.com/learning-center/trading-investing/technical-analysis/technical-indicator-guide/roc
- Rate of Change (ROC) — StockCharts.com ChartSchool. 2024. https://chartschool.stockcharts.com/table-of-contents/technical-indicators-and-overlays/technical-indicators/rate-of-change-roc
This article is general information, not personal financial advice. Consider your own situation, or speak with a licensed adviser, before acting on it.


