

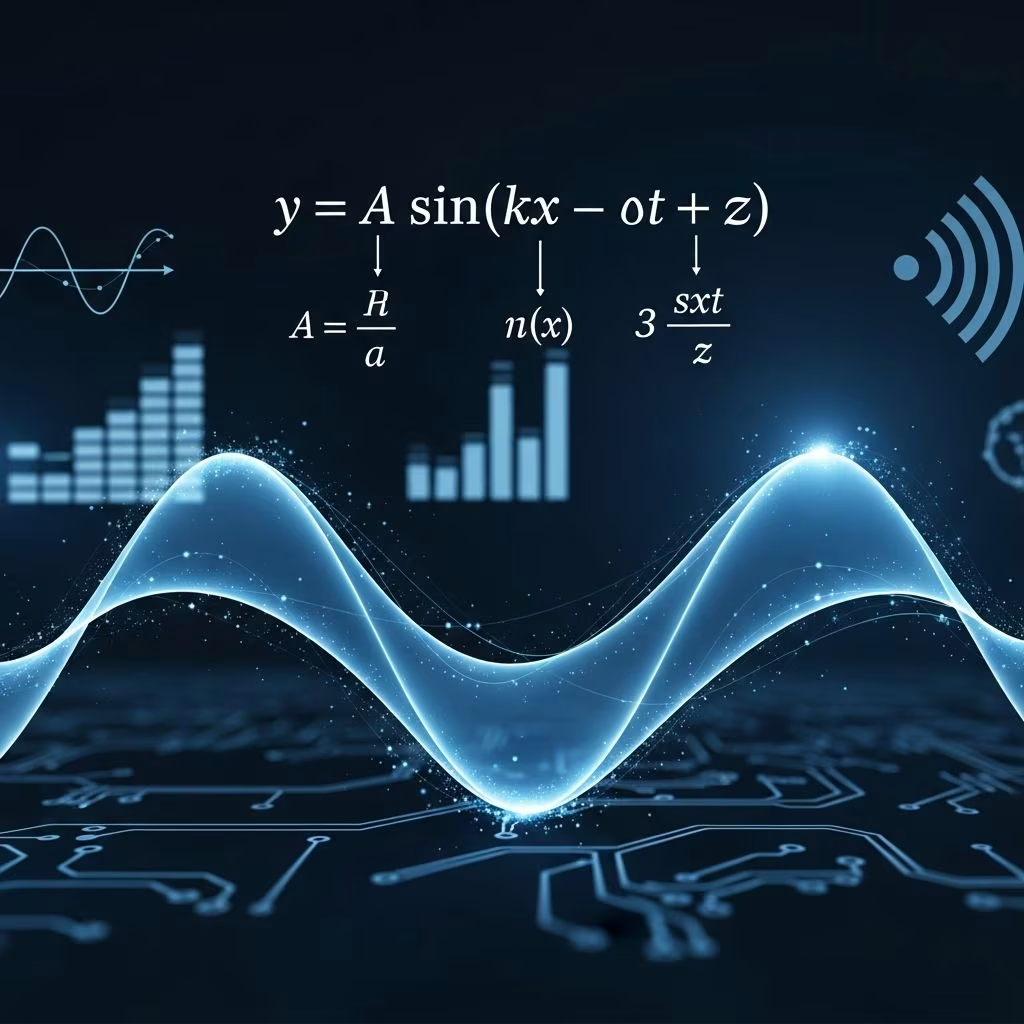
What Is a Sine Wave?
A sine wave, also known as a sinusoidal wave or sinusoid, is a periodic wave whose waveform is based on the trigonometric sine function. The mathematical symbol for a sine wave is ∿. In the context of trading and financial markets, sine waves represent smooth, periodic oscillating patterns that repeat at regular intervals. These mathematical curves are fundamental to understanding cyclical market behavior and are widely used in technical analysis to identify potential turning points in asset prices.
The sine wave is one of the most important periodic waveforms in mathematics, physics, and engineering. In trading applications, analysts use sine wave patterns to predict market reversals and identify oversold or overbought conditions. The predictable nature of sine waves makes them valuable tools for traders seeking to understand underlying market cycles and momentum.
Understanding the Sine Wave Formula
The mathematical representation of a sine wave is expressed through a fundamental equation. The basic sine wave formula is written as:
y(t) = A sin(ωt + φ)
Where each variable represents a specific characteristic of the wave:
- y(t) — the output value of the function at time t
- A — the amplitude, representing the peak deviation from the center line
- ω — the angular frequency, measured in radians per second
- t — time, typically measured in seconds
- φ — the phase shift, determining where the wave begins its cycle
For waves propagating through space, the formula expands to include spatial dimensions:
y(x,t) = A sin(kx − ωt + φ)
This extended formula accounts for the wave’s movement through two-dimensional space, with k representing the wave number and x representing position along the propagation dimension.
Key Components of a Sine Wave
Understanding the individual components of a sine wave is essential for traders and analysts who wish to apply sine wave analysis to market data:
Amplitude (A)
Amplitude represents the maximum vertical distance the wave reaches from its center line. In trading applications, amplitude reflects the strength and magnitude of market moves. A larger amplitude indicates more volatile price swings, while smaller amplitude suggests consolidation or low-volatility periods. Traders monitor amplitude changes to gauge market intensity and determine risk levels.
Frequency (f)
Frequency describes how many complete cycles or oscillations occur within a specific time period, typically measured as cycles per second. In financial markets, frequency helps traders identify whether they are looking at short-term price fluctuations or longer-term cyclical patterns. Higher frequency sine waves complete their cycles faster, while lower frequency waves take longer to complete full oscillations.
Angular Frequency (ω)
Angular frequency, measured in radians per second, represents the rate at which the wave cycles through its complete pattern. It is related to ordinary frequency by the formula ω = 2πf. Angular frequency is crucial for mathematical analysis and signal processing applications in technical analysis.
Phase (φ)
Phase specifies where the sine wave is positioned within its cycle at a given starting point (typically when t = 0). When phase is non-zero, the entire waveform appears shifted in time. A positive phase represents an advance, while a negative phase represents a delay. Phase differences between multiple sine waves are particularly important in trading when comparing multiple oscillators or indicators.
Period (T)
The period represents the time required for one complete oscillation cycle. The period is inversely related to frequency, expressed as T = 1/f. Understanding the period helps traders determine timeframes for their analysis and identify the duration of market cycles they are studying.
Mathematical Properties and Operations
Sine waves possess unique mathematical properties that make them particularly valuable for financial analysis:
Wave Addition and Linear Combination
When two sine waves of the same frequency are combined linearly, the result is another sine wave of identical frequency. This property is unique among periodic waves and is fundamental to Fourier analysis. Traders use this principle when combining multiple technical indicators, as the resulting composite signal maintains predictable characteristics.
Differentiation and Integration
The derivative of a sine wave produces a cosine wave, while integration of a sine wave produces a negative cosine wave. These mathematical operations reveal rate-of-change information critical for momentum analysis. The derivative shows velocity (rate of price change), while the integral reveals accumulated displacement (cumulative price movement).
Fourier Decomposition
Complex periodic functions can be decomposed into a sum of sine and cosine waves of various frequencies, amplitudes, and phases. This principle, known as Fourier analysis, allows traders to break down complex price patterns into their fundamental cyclical components, revealing hidden market rhythms.
Sine Waves in Trading and Technical Analysis
Professional traders and technical analysts employ sine wave concepts to develop indicators and trading strategies:
Sine Wave Indicators
Various technical indicators based on sine wave mathematics help traders identify market conditions. These indicators track oscillating patterns within price data and generate signals when sine wave components cross predetermined levels. The major trading signals typically occur at the crossings of key waveforms, providing entry and exit points for trading strategies.
Market Cycle Identification
Markets exhibit cyclical behavior that can be modeled using sine wave patterns. By identifying the underlying cycles, traders can anticipate market turning points—both tops and bottoms. The same indicators that identify tops can signal bottoms when they reach reflecting boundaries, depending on whether those boundaries represent potential resistance (top) or support (bottom) levels.
Momentum and Trend Analysis
Sine wave-based indicators help traders distinguish between trending markets and ranging markets. When sine waves are in the early or middle stages of their cycle, they reflect strong directional moves. When sine waves approach their peaks or troughs, reversals become more likely, signaling potential trend changes.
Real-World Applications Beyond Trading
While sine waves are extensively used in financial markets, their applications extend far beyond trading:
Sound and Acoustics
Sound waves travel as sine wave patterns through air at approximately 340 kilometers per hour in dry air at 20 degrees Celsius. When you listen to music through a speaker or headphone, your brain interprets sound waves that are in the form of sine waves. The frequency of these sine waves determines the pitch you hear, while amplitude determines the volume.
Electromagnetic Radiation
Light waves, radio waves, and other forms of electromagnetic radiation propagate as sinusoidal waves. The frequency of these waves determines their properties—from radio frequencies measured in kilohertz to visible light measured in terahertz. All electromagnetic phenomena follow sine wave mathematics, making this pattern fundamental to understanding the physical universe.
Mechanical Systems
Simple harmonic motion in mechanical systems—such as a pendulum, spring, or vibrating string—follows sine wave patterns. The position, velocity, and acceleration of oscillating objects all exhibit sinusoidal behavior. This principle extends to rotating systems, where uniform circular motion can be represented as sine waves viewed from different perspectives.
Advantages of Sine Wave Analysis
- Predictability — Sine waves follow mathematical rules, making their behavior predictable and analyzable
- Universal Application — The same mathematical principles apply across different markets and timeframes
- Early Warning Signals — Sine wave analysis can identify potential reversals before they become obvious in price action
- Precise Entry and Exit Points — Crossings of sine wave components provide specific trading signals
- Noise Filtering — Sine wave indicators filter out market noise and highlight underlying cyclical patterns
Limitations and Considerations
Despite their usefulness, sine wave analysis has important limitations. Markets do not always behave according to perfect sine wave patterns. During crises or unusual events, sine wave models may fail to predict actual market behavior. Additionally, sine wave indicators can generate false signals during choppy or sideways markets where clear cycles do not exist. Traders should never rely exclusively on sine wave analysis and should combine it with other technical and fundamental analysis tools.
Comparing Sine Waves with Other Wave Types
| Wave Type | Characteristics | Trading Applications |
|---|---|---|
| Sine Wave | Smooth, continuous, perfectly periodic | Cycle identification, momentum measurement |
| Square Wave | Sharp transitions, on-off patterns | Binary decision signals, trend confirmation |
| Triangle Wave | Linear rise and fall, sharp peaks | Acceleration analysis, momentum reversal |
| Sawtooth Wave | Rapid rise, sudden drop | Gap identification, shock events |
Frequently Asked Questions About Sine Waves
Q: How do traders use sine waves to predict market reversals?
A: Traders use sine wave indicators to identify when oscillating patterns reach extreme points (peaks or troughs), which often precede market reversals. When a sine wave indicator reaches overbought or oversold conditions, traders anticipate potential reversals. Additionally, crossings between sine wave components generate trading signals at inflection points.
Q: Can sine wave analysis work on all timeframes?
A: Yes, sine wave mathematics apply across all timeframes, from one-minute charts to yearly charts. However, the effectiveness varies depending on market conditions. Short-term charts may show more noise and false signals, while longer-term charts tend to reveal clearer cyclical patterns that align better with theoretical sine wave behavior.
Q: What is the difference between frequency and period in sine waves?
A: Frequency measures how many complete cycles occur per unit of time, while period measures how long one complete cycle takes. They are inversely related: if a sine wave has a frequency of 2 cycles per second, its period is 0.5 seconds. In trading, frequency identifies fast-moving cycles while period identifies the duration of market patterns.
Q: Are real market prices actually sine waves?
A: Real market prices are not perfect sine waves, but they do exhibit cyclical behavior that can be modeled and analyzed using sine wave principles. Fourier analysis breaks down complex price patterns into multiple sine wave components, revealing underlying cycles. Markets behave like sine waves during stable conditions but deviate significantly during crises or unusual events.
Q: How do phase differences affect trading signals?
A: Phase differences between multiple sine wave-based indicators can create powerful trading signals. When indicators with phase differences cross, they generate entry or exit signals. A leading indicator (advanced phase) can warn of potential reversals before they appear in lagging indicators (delayed phase).
Q: Can sine wave analysis be combined with other technical indicators?
A: Absolutely. Combining sine wave analysis with moving averages, trend lines, support/resistance levels, and other indicators improves signal reliability. Using multiple analytical approaches reduces false signals and increases confidence in trading decisions. However, traders should avoid over-complicating their analysis systems.
References
- Sine wave — Wikipedia. Accessed 2025. https://en.wikipedia.org/wiki/Sine_wave
- Trigonometric Law in Sine Waves of Music — International Journal of Scientific Development and Research (IJSDR). 2024. https://www.ijsdr.org/papers/IJSDR2408027.pdf
- OneLook Dictionary — Definition of sine wave in trigonometry and signal processing. Accessed 2025. https://onelook.com/?w=sine+wave
This article is general information, not personal financial advice. Consider your own situation, or speak with a licensed adviser, before acting on it.


