

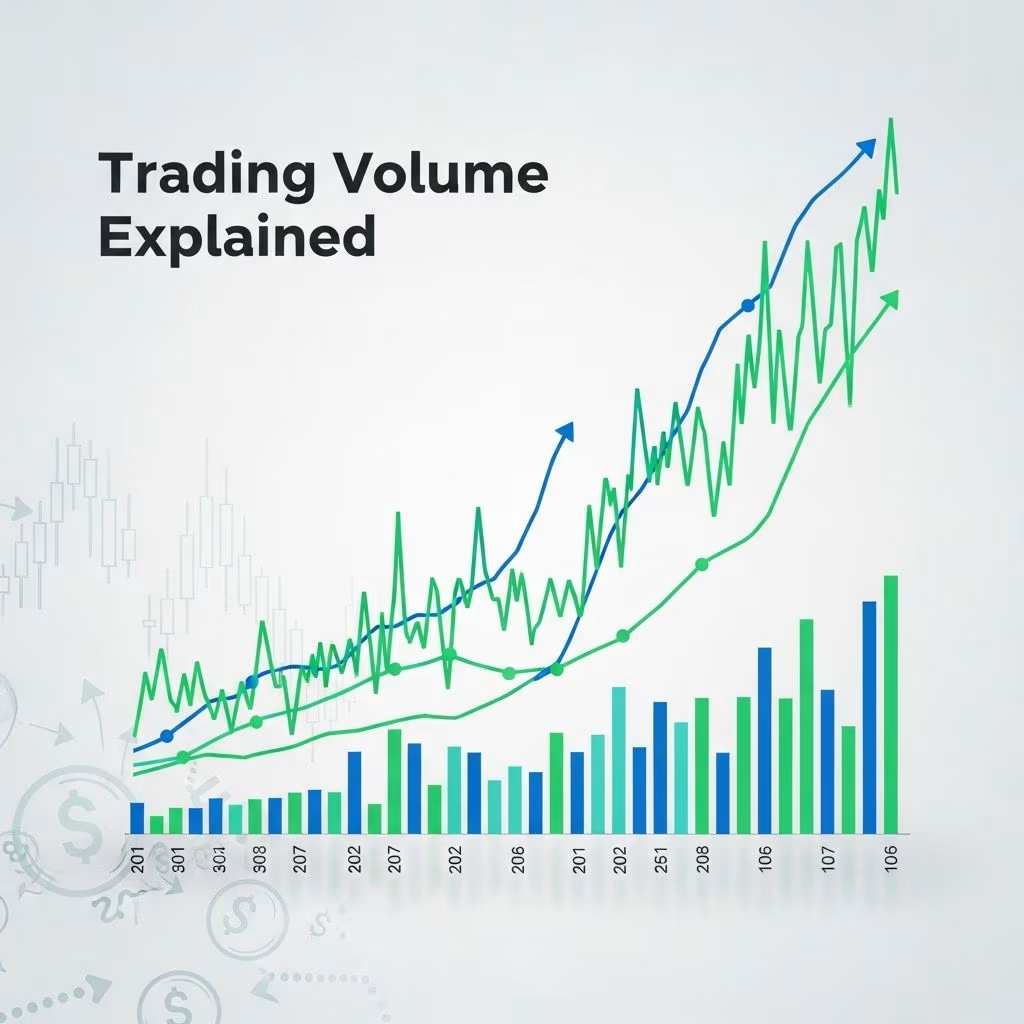
Trading volume represents the total quantity of a financial instrument exchanged between buyers and sellers over a defined timeframe, serving as a critical gauge of market participation and vitality.
Defining Trading Volume in Financial Markets
In essence, trading volume quantifies market activity by counting the units of securities transferred in transactions. For equities, this means shares traded; for derivatives like futures or options, it counts contracts completed. Each trade, where a buyer accepts a seller’s offer at an agreed price, contributes once to the volume tally, regardless of the trade size.
Consider a stock with 500 shares changing hands across multiple deals in a session: the volume registers as 500 shares, not doubled for both sides of the transaction. This metric applies across asset classes, from bonds and commodities to cryptocurrencies, adapting to each’s standard unit.
How Trading Volume Gets Measured Across Assets
Exchanges aggregate volume from all trades executed on their platforms during standard sessions, typically reporting daily totals but also intraday figures. Stocks use share counts, while futures and options rely on contract numbers, ensuring comparability within categories.
Volume measurement breaks into types like volume-by-timeframe, plotting activity per interval (e.g., 5-minute bars), and volume-by-price, showing trades at specific levels. Average daily volume, calculated as total shares over a period divided by days, provides a baseline for normality, often over 30 or 90 days.
| Asset Type | Volume Unit | Example Daily Volume |
|---|---|---|
| Stocks | Shares | 1,000,000 shares |
| Futures | Contracts | 5,000 contracts |
| Options | Contracts | 2,500 contracts |
| ETFs | Shares | 500,000 shares |
This table illustrates standard measurement, highlighting how volume scales with asset liquidity.
The Role of Volume in Gauging Market Liquidity
High volume denotes robust liquidity, enabling swift order fills at stable prices with minimal slippage. Liquid assets attract more participants, fostering efficient markets where large positions enter or exit without disruption.
Conversely, low-volume securities suffer illiquidity, amplifying price swings from modest trades and complicating executions. Investors favor high-volume names for their predictability and reduced risk in volatile conditions.
- High Volume Benefits: Tight bid-ask spreads, fast fills, trend stability.
- Low Volume Risks: Wide spreads, delayed trades, exaggerated volatility.
Volume’s Power in Validating Price Movements
Traders scrutinize volume alongside price to assess move conviction. A price surge on elevated volume signals strong buyer commitment, suggesting sustainability; low-volume advances often falter.
Declines mirror this: heavy volume drops indicate capitulation or bearish resolve, while light selling hints at temporary dips. This confirmation principle underpins technical analysis, distinguishing genuine trends from traps.
Key Volume Patterns and Their Implications
Markets exhibit distinct volume signatures revealing underlying dynamics. Spikes often precede breakouts, where price pierces resistance on surging participation, validating directional shifts.
Divergences flag warnings: rising prices with waning volume suggest fading momentum, portending reversals; falling prices on rising volume may accelerate declines. Volume shelves—concentrated activity at levels—mark support or resistance zones.
Climax volume, extreme peaks after trends, frequently signals exhaustion, prompting counter-trend plays.
Advanced Volume Analysis Tools for Traders
Beyond raw figures, indicators harness volume for deeper insights. On-Balance Volume (OBV) cumulates volume by price direction, tracking accumulation or distribution flows.
Money Flow Index (MFI) blends price and volume into an oscillator spotting overbought/oversold states. Volume Rate of Change (VROC) measures volume momentum, confirming breakouts via acceleration.
Volume Profile visualizes activity by price, identifying high-volume nodes as pivotal levels for entries or targets.
- OBV: Rising with price confirms uptrends; divergence warns of weakness.
- MFI: Above 80 overbought; below 20 oversold.
- VROC: Spikes validate explosive moves.
Strategic Applications of Volume in Trading
Confirming Breakouts and Breakdowns
Breakout strategies demand volume expansion: upward breaches of resistance on 50-100% above-average volume boost success odds. Lacking surge, false breakouts lure traders into traps.
Spotting Reversals Through Divergence
Volume divergence excels at reversal detection. Bullish divergence—prices bottoming as volume climbs—hints at accumulation; bearish cases show distribution.
Volume in Trend Strength Assessment
Sustained trends feature volume progressively aligning: uptrends pull buyers on pullbacks, downtrends draw sellers on rallies.
Comparing Volume to Related Metrics
Volume differs from float (publicly tradable shares) and market cap (total value). High-volume low-float stocks amplify moves, earning ‘low-float runner’ status among day traders.
| Metric | Definition | Trading Insight |
|---|---|---|
| Volume | Shares/contracts traded | Activity and conviction |
| Float | Available shares | Squeeze potential |
| Market Cap | Shares x price | Company size |
Practical Tips for Incorporating Volume
Monitor relative volume (current vs. average) for context; thresholds like 1.5x signal interest. Combine with candlesticks: doji on high volume flags indecision; engulfing patterns amplify on volume.
Scan for volume surges pre-market or post-news. Avoid low-volume traps in after-hours trading.
Frequently Asked Questions
What does high trading volume mean?
High volume indicates strong interest, liquidity, and price move conviction, often sustaining trends.
Is low volume bad for stocks?
Low volume suggests weak participation, increasing volatility risk and execution challenges.
How does volume confirm trends?
Trends on rising volume show commitment; declining volume warns of exhaustion.
Can volume predict reversals?
Yes, via divergences and climaxes where volume extremes signal shifts.
What’s average volume?
Total volume over a period (e.g., 30 days) divided by days, benchmarking normality.
Limitations and Best Practices
Volume alone misleads without price context; dark pools obscure exchange data. Cross-verify with fundamentals for long-term holds. Backtest strategies, manage risk via stops, and diversify.
References
- What Is Trading Volume and How Is It Measured? — Chase. 2023. https://www.chase.com/personal/investments/learning-and-insights/article/what-is-trading-volume-and-how-is-it-measured
- Volume (finance) — Wikipedia. 2024-02-01. https://en.wikipedia.org/wiki/Volume_(finance)
- What Is Trading Volume? — TrendSpider Learning Center. 2024. https://trendspider.com/learning-center/what-is-trading-volume/
- What Is Volume in Stock Trading? — SoFi. 2024. https://www.sofi.com/learn/content/what-is-volume-in-stocks/
- Trading Volume as a Market Indicator — Charles Schwab. 2024. https://www.schwab.com/learn/story/trading-volume-as-market-indicator
- Trading volume Definition — Nasdaq. 2024. https://www.nasdaq.com/glossary/t/trading-volume
This article is general information, not personal financial advice. Consider your own situation, or speak with a licensed adviser, before acting on it.


