
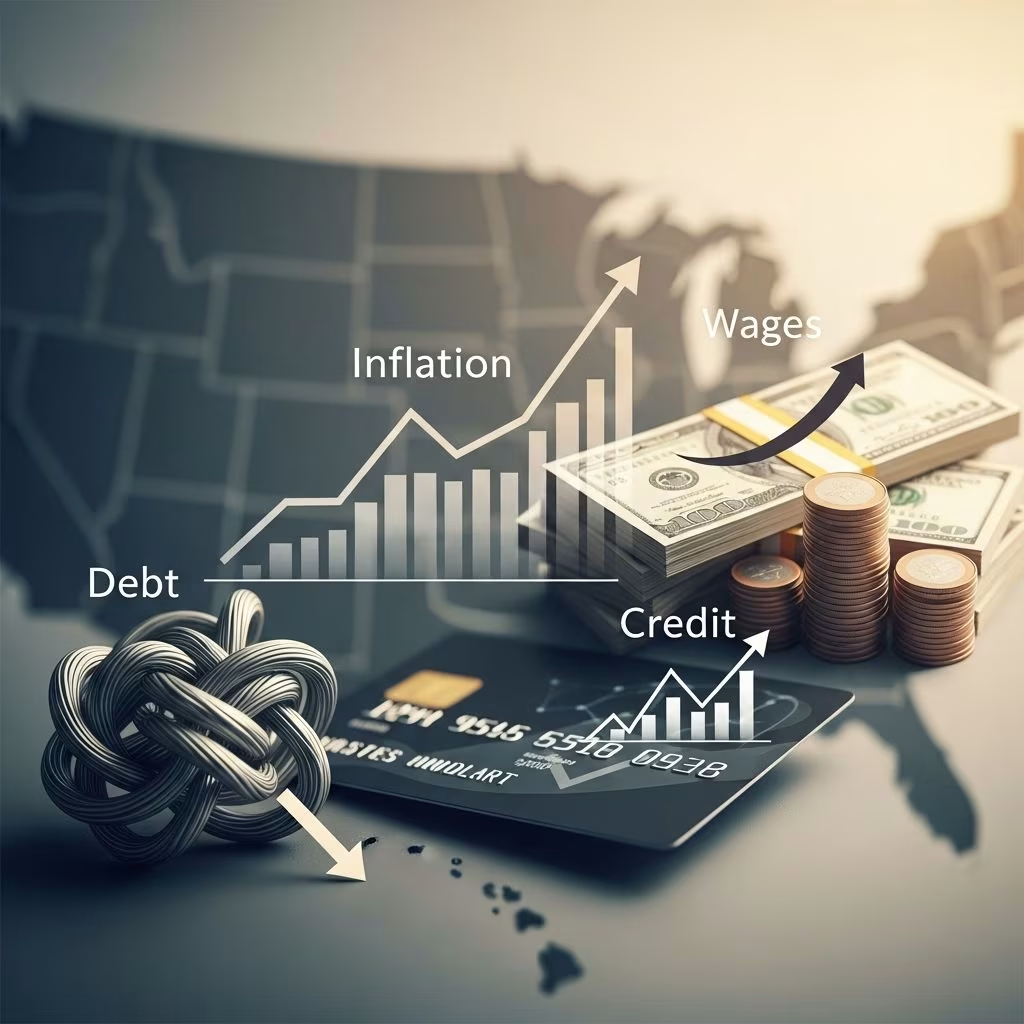
In 2026, American households navigate a complex economic landscape where inflation shows signs of moderation, wage growth provides some relief, yet credit dependence and debt burdens persist. Recent data reveals consumer prices rose 2.4% over the 12 months ending January 2026, down from 2.7% the prior year, offering a glimmer of stability. Meanwhile, surveys indicate ongoing worries about job security and future price pressures, influencing spending and borrowing habits.
Inflation Dynamics: A Gradual Cool-Down with Lingering Risks
Inflation, a persistent concern since recent years, appears to be easing but not without potential rebounds. The Consumer Price Index (CPI) for all urban consumers climbed 2.4% year-over-year through February 2026, matching January’s pace after a monthly 0.3% increase. Core components like shelter continue driving gains, with a 0.2% monthly rise, while food prices edged up 0.4% and energy 0.6% in February.
Consumer expectations reflect caution: a New York Federal Reserve survey from late 2025 showed median one-year-ahead inflation forecasts at 3.4%, up slightly from prior months. Longer-term outlooks hold steady at 3% over three to five years. Analysts warn of upside risks from tariffs, fiscal expansion, and tighter labor markets, potentially pushing inflation above 4% by year-end.
- Key CPI Breakdown (Year-over-Year to Jan 2026): All items: 2.4%; Food at home: 2.1%; Food away: 4.0%; Energy: -0.1%; Core (less food/energy): 2.5%.
- Shelter and services remain sticky, contributing most to monthly changes.
- Potential drivers: Tariffs could add 1% to inflation per some projections.
Wage Growth Outpacing Prices: Real Income Gains Emerge
For the first time in years, wages are consistently surpassing inflation, bolstering household purchasing power. In December 2024, wages grew 4.2% year-over-year against 2.9% inflation, a trend holding into 2026 where inflation lingers around 2.4%. Employers anticipate merit increases averaging 3.2% for 2026, flat from 2025 levels, signaling steady but not aggressive compensation.
This divergence means real wage growth—wages adjusted for inflation—averages about 1.5-2%, helping consumers absorb higher costs for essentials like food away from home (up 4.1% YoY). However, labor market softening tempers optimism: job loss fears rose to 15.2% probability over the next year, while job-finding odds dropped to a low 43.1%.
| Period | Inflation Rate (% YoY) | Wage Growth (% YoY) | Real Wage Growth (%) |
|---|---|---|---|
| Dec 2024 | 2.9 | 4.2 | 1.3 |
| Jan 2026 | 2.4 | ~4.0 (est.) | ~1.6 |
| Feb 2026 | 2.4 | ~4.0 (est.) | ~1.6 |
Note: Wage estimates based on recent trends; real growth calculated as nominal wages minus inflation.
Credit Usage on the Rise: Buffering Economic Pressures
As inflation eases but job anxieties mount, consumers increasingly turn to credit to maintain lifestyles. Credit card balances have surged, reflecting reliance on revolving debt for daily expenses amid uneven wage distribution. Lower-income households, facing higher effective inflation on necessities, show sharper upticks in utilization rates.
Despite wage gains, 40% of consumers report living paycheck-to-paycheck, driving credit card spending growth of over 5% annually. This trend aligns with broader economic signals: while high earners benefit from investments, middle-class families lean on cards for groceries and utilities, where prices rose faster than headline CPI.
- Prime borrowers: Average credit card APR nears 22%, yet balances grow modestly.
- Subprime: Delinquency risks elevate as minimum payments strain budgets.
- Overall: Transunion data shows credit inquiries up 8% YoY, signaling borrowing intent.
Debt Profiles: Mortgages Dominate, Student Loans Linger
Total household debt exceeds $17 trillion, with mortgages comprising 70% at $12.3 trillion. Average mortgage debt per borrower stands at $240,000, buoyed by home values but pressured by 6.5% rates. Auto loans average $28,000, with subprime delinquencies ticking up to 4.5%.
Student debt averages $38,000 per borrower, totaling $1.6 trillion; forbearance ends push repayments, yet 25% of balances are 90+ days delinquent. Credit card debt averages $6,500, up 10% from 2024, as inflation-weary consumers revolve balances.
Generational shifts: Gen Z carries $15,000 average total debt (mostly student/credit); Millennials $50,000 (mortgage-heavy); Gen X peaks at $140,000.
| Debt Type | Average Balance | Total Market | Delinquency Rate |
|---|---|---|---|
| Mortgage | $240,000 | $12.3T | 0.6% |
| Auto | $28,000 | $1.6T | 4.5% |
| Student | $38,000 | $1.6T | 25% (90+ days) |
| Credit Card | $6,500 | $1.1T | 8.5% |
Consumer Sentiment: Optimism Tempered by Uncertainty
Despite positive wage-inflation dynamics, sentiment surveys reveal mixed views. University of Michigan index hovers at 78, up from pandemic lows but below pre-2022 peaks. Job market fears dominate: 15.2% unemployment risk perception, lowest job-find odds in series history.
Spending intentions: 60% plan to maintain budgets, 25% cut back on non-essentials. Big-ticket purchases like homes and cars slow, with mortgage applications down 15% YoY.
Regional Variations: Costs Hit Differently Across States
Inflation isn’t uniform: Northeast sees 2.8% CPI (high shelter), South at 2.2% (energy moderation). Wages vary too—tech hubs like California average 5% growth, Rust Belt lags at 3.5%.
- High-cost states (CA, NY): Debt-to-income ratios exceed 40%.
- Affordable regions (TX, FL): Faster credit score gains.
Strategies for Financial Resilience in 2026
To counter trends:
- Budgeting: Track essentials; allocate 50% income to needs.
- Debt Paydown: Prioritize high-interest cards via avalanche method.
- Building Credit: Keep utilization under 30%; pay on time.
- Savings: Aim for 3-6 months expenses in high-yield accounts (4-5% APY).
- Investing: Diversify into index funds amid expected rate cuts.
Future Outlook: What Lies Ahead
Forecasts suggest inflation stabilizing near 2.5%, Fed cuts to 4% funds rate by mid-year. Wages hold 3.5-4%, but recession odds at 30% could spike delinquencies. Tariffs and policy shifts pose inflation risks.
Frequently Asked Questions (FAQs)
What is the current US inflation rate in 2026?
The CPI rose 2.4% over 12 months ending February 2026.
Are wages keeping up with inflation?
Yes, wage growth at ~4% exceeds 2.4% inflation, yielding positive real gains.
How much credit card debt does the average American have?
Around $6,500, with total revolving debt at $1.1 trillion.
What drives consumer debt increases?
Inflation on necessities, job uncertainty, and easy credit access.
Will interest rates fall in 2026?
Markets price in cuts, potentially easing borrowing costs.
Navigating these trends requires proactive financial habits. Monitor personal credit reports regularly and adjust spending to build long-term security.
References
- Consumers head into 2026 with worries about inflation and jobs — CFO.com. 2026-01 (approx.). https://www.cfo.com/news/consumers-cfo-finance-outlook-head-into-2026-with-worries-about-inflation-jobs-cpi/809451/
- The risk of higher US inflation in 2026 — Peterson Institute for International Economics (PIIE). 2026. https://www.piie.com/blogs/realtime-economics/2026/risk-higher-us-inflation-2026
- Consumer prices up 2.4 percent over the year ended January 2026 — U.S. Bureau of Labor Statistics (BLS). 2026-02-18. https://www.bls.gov/opub/ted/2026/consumer-prices-up-2-4-percent-over-the-year-ended-january-2026.htm
- Wage growth vs inflation in the U.S. 2026 — Statista. 2026. https://www.statista.com/statistics/1351276/wage-growth-vs-inflation-us/
- Consumer Price Index Summary – 2026 M02 Results — U.S. Bureau of Labor Statistics (BLS). 2026-03-11. https://www.bls.gov/news.release/cpi.nr0.htm
- The U.S. economy in 2026: What to watch for — Stanford Institute for Economic Policy Research (SIEPR). 2026. https://siepr.stanford.edu/publications/policy-brief/us-economy-2026-what-watch
- Most US employers plan to keep 2026 salary increases flat — Mercer. 2026. https://www.mercer.com/en-us/about/newsroom/most-us-employers-plan-to-keep-2026-salary-increases-flat/
This article is general information, not personal financial advice. Consider your own situation, or speak with a licensed adviser, before acting on it.